Cluster: c17
Markers
The markers are found using Seurat's FindMarkers function, and filtered by: p_val_adj < 0.05 & avg_log2FC > 0
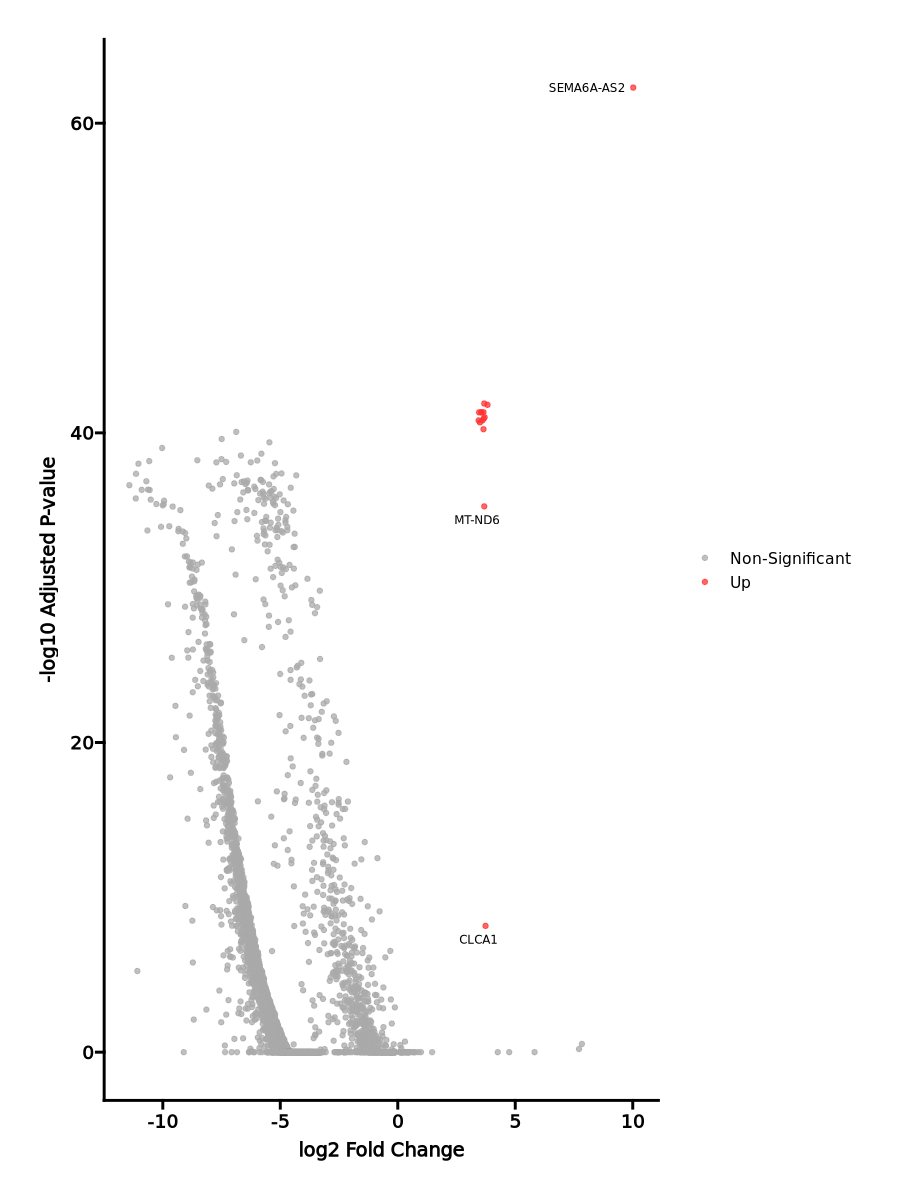
| 1.493e-67 | 10.0203 | 0.014 | 0 | 5.008e-63 | c17 | SEMA6A-AS2 |
| 3.79e-47 | 3.6806 | 1 | 0.998 | 1.271e-42 | c17 | MT-CYB |
| 4.603e-47 | 3.8196 | 1 | 0.997 | 1.544e-42 | c17 | MT-ATP6 |
| 1.391e-46 | 3.6469 | 1 | 0.999 | 4.664e-42 | c17 | MT-CO1 |
| 1.4e-46 | 3.556 | 1 | 0.998 | 4.696e-42 | c17 | MT-ND4L |
| 1.408e-46 | 3.4598 | 1 | 0.992 | 4.722e-42 | c17 | MT-ND1 |
| 1.427e-46 | 3.5596 | 1 | 0.991 | 4.785e-42 | c17 | MT-ND5 |
| 2.94e-46 | 3.6969 | 1 | 0.996 | 9.861e-42 | c17 | MT-ATP8 |
| 3.519e-46 | 3.6583 | 1 | 0.998 | 1.18e-41 | c17 | MT-CO3 |
| 4.676e-46 | 3.4418 | 1 | 0.994 | 1.568e-41 | c17 | MT-ND3 |
| 4.72e-46 | 3.6038 | 1 | 0.998 | 1.583e-41 | c17 | MT-CO2 |
| 6.237e-46 | 3.4975 | 1 | 0.967 | 2.092e-41 | c17 | MT-ND2 |
| 1.733e-45 | 3.6473 | 1 | 0.967 | 5.812e-41 | c17 | MT-ND4 |
| 1.671e-40 | 3.6798 | 0.972 | 0.839 | 5.603e-36 | c17 | MT-ND6 |
| 0 | 3.7351 | 0.028 | 0.001 | 0 | c17 | CLCA1 |
Downloading entire data
You must use "Save as" or "Save link as" from the context menu (by right-clicking the button) to download the entire data.
The volcano plot is generated using ggplot2. The significant markers are highlighted in blue and red, indicating up-regulated and down-regulated genes, respectively. The non-significant genes are shown in grey.
Image loading error!
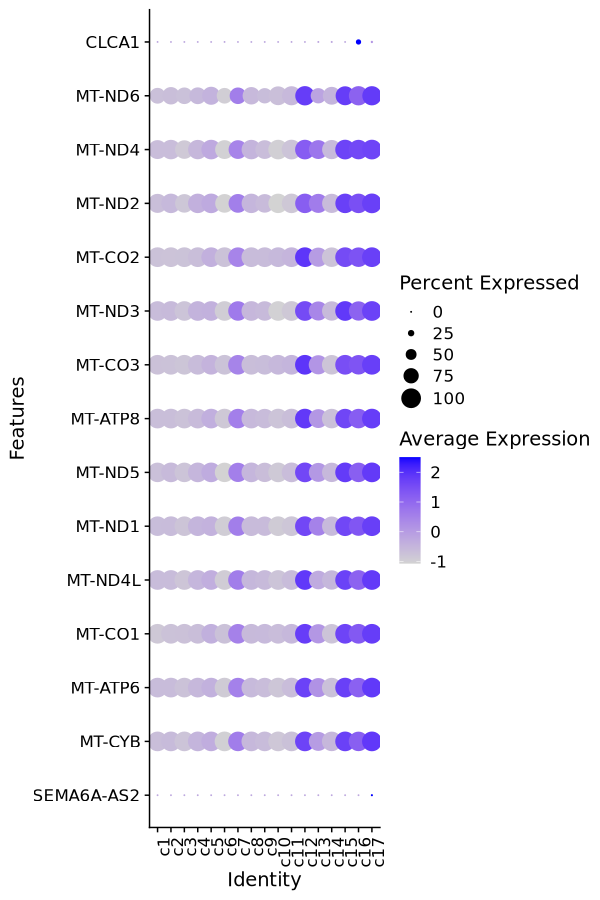
The dot plot is generated using Seurat's DotPlot function. The top significant markers are used as input. The sizes of the dots are proportional to the percentage of cells expressing the gene in each group. The colors of the dots are proportional to the average expression of the gene in each group.
Image loading error!
Enrichment Analysis
The enrichment analysis is done using Enrichr. The significant markers are used as input.
- The enrichment analysis results of the top biological pathways associated with the input gene set. Each bar represents a pathway, with the length of the bar indicating the number of input genes overlapping with genes in that pathway. The color intensity of the bars reflects the statistical significance of the enrichment (p-value).Image loading error!
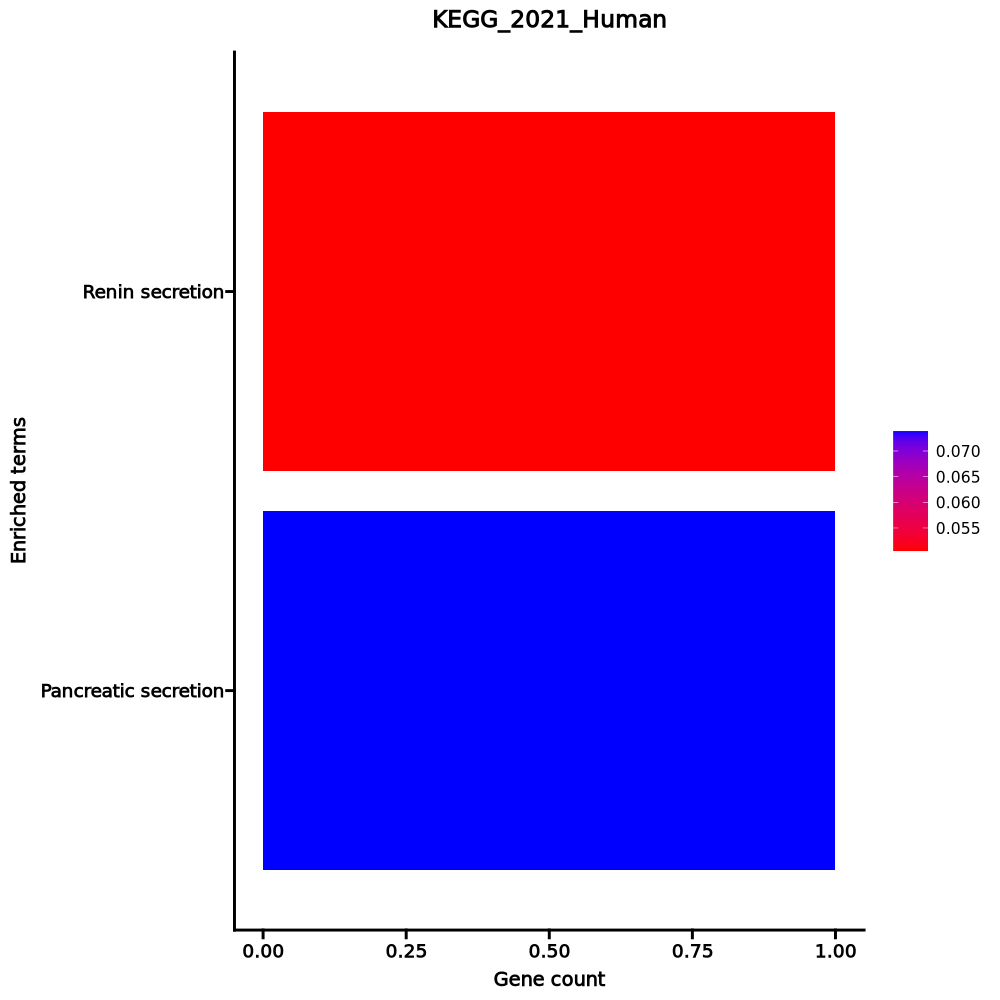
Renin secretion 1/69 0.0505 0.0739 0 0 20.9212 62.4514 CLCA1 Pancreatic secretion 1/102 0.0739 0.0739 0 0 14.0622 36.6417 CLCA1 1–2 of 2 itemsof 1 pageDownloading entire data
You must use "Save as" or "Save link as" from the context menu (by right-clicking the button) to download the entire data.
Running Information
Showing the first job only. Check the workdir for information of other jobs if any.
# Generated by pipen_runinfo v0.8.2
# Lang: R
R version 4.3.3 (2024-02-29)
Platform: x86_64-conda-linux-gnu (64-bit)
Running under: Debian GNU/Linux 11 (bullseye)

Matrix products: default
BLAS/LAPACK: /opt/conda/lib/libopenblasp-r0.3.28.so;  LAPACK version 3.12.0

locale:
 [1] LC_CTYPE=C.UTF-8       LC_NUMERIC=C           LC_TIME=C.UTF-8
 [4] LC_COLLATE=C.UTF-8     LC_MONETARY=C.UTF-8    LC_MESSAGES=C.UTF-8
 [7] LC_PAPER=C.UTF-8       LC_NAME=C              LC_ADDRESS=C
[10] LC_TELEPHONE=C         LC_MEASUREMENT=C.UTF-8 LC_IDENTIFICATION=C

time zone: Etc/UTC
tzcode source: system (glibc)

attached base packages:
[1] stats     graphics  grDevices utils     datasets  methods   base

other attached packages:
 [1] UpSetR_1.4.0        ggVennDiagram_1.2.3 tidyseurat_0.8.0
 [4] ttservice_0.4.1     future_1.34.0       ggrepel_0.9.6
 [7] ggprism_1.0.5       ggplot2_3.5.1       enrichR_3.4
[10] Seurat_5.1.0        SeuratObject_5.0.2  sp_2.2-0
[13] tibble_3.2.1        tidyr_1.3.1         dplyr_1.1.4
[16] tidyselect_1.2.1    digest_0.6.37       jsonlite_1.8.9
[19] rlang_1.1.5         logger_0.4.0

loaded via a namespace (and not attached):
  [1] deldir_2.0-4           pbapply_1.7-2          gridExtra_2.3
  [4] magrittr_2.0.3         RcppAnnoy_0.0.22       matrixStats_1.1.0
  [7] ggridges_0.5.6         compiler_4.3.3         spatstat.geom_3.3-5
 [10] png_0.1-8              vctrs_0.6.5            reshape2_1.4.4
 [13] stringr_1.5.1          pkgconfig_2.0.3        fastmap_1.2.0
 [16] ellipsis_0.3.2         labeling_0.4.3         promises_1.3.2
 [19] purrr_1.0.2            WriteXLS_6.7.0         RVenn_1.1.0
 [22] goftest_1.2-3          later_1.4.1            spatstat.utils_3.1-2
 [25] irlba_2.3.5.1          parallel_4.3.3         cluster_2.1.8
 [28] R6_2.6.0               ica_1.0-3              stringi_1.8.4
 [31] RColorBrewer_1.1-3     spatstat.data_3.1-4    limma_3.58.1
 [34] reticulate_1.40.0      parallelly_1.42.0      spatstat.univar_3.1-1
 [37] lmtest_0.9-40          scattermore_1.2        Rcpp_1.0.14
 [40] tensor_1.5             future.apply_1.11.3    zoo_1.8-12
 [43] sctransform_0.4.1      httpuv_1.6.15          Matrix_1.6-5
 [46] splines_4.3.3          igraph_2.0.3           abind_1.4-5
 [49] spatstat.random_3.3-2  codetools_0.2-20       miniUI_0.1.1.1
 [52] spatstat.explore_3.3-4 curl_6.0.1             listenv_0.9.1
 [55] lattice_0.22-6         plyr_1.8.9             withr_3.0.2
 [58] shiny_1.10.0           ROCR_1.0-11            Rtsne_0.17
 [61] fastDummies_1.7.5      survival_3.8-3         polyclip_1.10-7
 [64] fitdistrplus_1.2-2     pillar_1.10.1          KernSmooth_2.23-26
 [67] plotly_4.10.4          generics_0.1.3         RcppHNSW_0.6.0
 [70] munsell_0.5.1          scales_1.3.0           globals_0.16.3
 [73] xtable_1.8-4           glue_1.8.0             lazyeval_0.2.2
 [76] tools_4.3.3            data.table_1.16.4      RSpectra_0.16-2
 [79] RANN_2.6.2             leiden_0.4.3.1         dotCall64_1.2
 [82] cowplot_1.1.3          grid_4.3.3             colorspace_2.1-1
 [85] nlme_3.1-167           patchwork_1.3.0        presto_1.0.0
 [88] cli_3.6.4              spatstat.sparse_3.1-0  fansi_1.0.6
 [91] spam_2.11-1            viridisLite_0.4.2      uwot_0.2.2
 [94] gtable_0.3.6           progressr_0.15.1       rjson_0.2.23
 [97] htmlwidgets_1.6.4      farver_2.1.2           htmltools_0.5.8.1
[100] lifecycle_1.0.4        httr_1.4.7             statmod_1.5.0
[103] mime_0.12              MASS_7.3-60.0.1
# Generated by pipen-runinfo v0.8.2

real 331.52
user 244.67
sys 12.58
percent 77%
# Generated by pipen-runinfo v0.8.2

Scheduler
---------
local

Hostname
--------
mforgehn4.mayo.edu

CPU
----
Architecture:                         x86_64
CPU op-mode(s):                       32-bit, 64-bit
Byte Order:                           Little Endian
Address sizes:                        46 bits physical, 57 bits virtual
CPU(s):                               96
On-line CPU(s) list:                  0-95
Thread(s) per core:                   2
Core(s) per socket:                   24
Socket(s):                            2
NUMA node(s):                         2
Vendor ID:                            GenuineIntel
CPU family:                           6
Model:                                106
Model name:                           Intel(R) Xeon(R) Gold 6342 CPU @ 2.80GHz
Stepping:                             6
CPU MHz:                              3500.000
CPU max MHz:                          3500.0000
CPU min MHz:                          800.0000
BogoMIPS:                             5600.00
Virtualization:                       VT-x
L1d cache:                            2.3 MiB
L1i cache:                            1.5 MiB
L2 cache:                             60 MiB
L3 cache:                             72 MiB
NUMA node0 CPU(s):                    0,2,4,6,8,10,12,14,16,18,20,22,24,26,28,30,32,34,36,38,40,42,44,46,48,50,52,54,56,58,60,62,64,66,68,70,72,74,76,78,80,82,84,86,88,90,92,94
NUMA node1 CPU(s):                    1,3,5,7,9,11,13,15,17,19,21,23,25,27,29,31,33,35,37,39,41,43,45,47,49,51,53,55,57,59,61,63,65,67,69,71,73,75,77,79,81,83,85,87,89,91,93,95
Vulnerability Gather data sampling:   Mitigation; Microcode
Vulnerability Itlb multihit:          Not affected
Vulnerability L1tf:                   Not affected
Vulnerability Mds:                    Not affected
Vulnerability Meltdown:               Not affected
Vulnerability Mmio stale data:        Mitigation; Clear CPU buffers; SMT vulnerable
Vulnerability Reg file data sampling: Not affected
Vulnerability Retbleed:               Not affected
Vulnerability Spec rstack overflow:   Not affected
Vulnerability Spec store bypass:      Mitigation; Speculative Store Bypass disabled via prctl
Vulnerability Spectre v1:             Mitigation; usercopy/swapgs barriers and __user pointer sanitization
Vulnerability Spectre v2:             Mitigation; Enhanced / Automatic IBRS; IBPB conditional; RSB filling; PBRSB-eIBRS SW sequence; BHI SW loop, KVM SW loop
Vulnerability Srbds:                  Not affected
Vulnerability Tsx async abort:        Not affected
Flags:                                fpu vme de pse tsc msr pae mce cx8 apic sep mtrr pge mca cmov pat pse36 clflush dts acpi mmx fxsr sse sse2 ss ht tm pbe syscall nx pdpe1gb rdtscp lm constant_tsc art arch_perfmon pebs bts rep_good nopl xtopology nonstop_tsc cpuid aperfmperf pni pclmulqdq dtes64 monitor ds_cpl vmx smx est tm2 ssse3 sdbg fma cx16 xtpr pdcm pcid dca sse4_1 sse4_2 x2apic movbe popcnt tsc_deadline_timer aes xsave avx f16c rdrand lahf_lm abm 3dnowprefetch cpuid_fault epb cat_l3 invpcid_single intel_ppin ssbd mba ibrs ibpb stibp ibrs_enhanced tpr_shadow vnmi flexpriority ept vpid ept_ad fsgsbase tsc_adjust bmi1 avx2 smep bmi2 erms invpcid cqm rdt_a avx512f avx512dq rdseed adx smap avx512ifma clflushopt clwb intel_pt avx512cd sha_ni avx512bw avx512vl xsaveopt xsavec xgetbv1 xsaves cqm_llc cqm_occup_llc cqm_mbm_total cqm_mbm_local split_lock_detect wbnoinvd dtherm ida arat pln pts avx512vbmi umip pku ospke avx512_vbmi2 gfni vaes vpclmulqdq avx512_vnni avx512_bitalg tme avx512_vpopcntdq la57 rdpid fsrm md_clear pconfig flush_l1d arch_capabilities

Memory
------
Powered by
pipen v0.15.7
and
pipen-report v0.21.4