Filters and QC
Filters applied
Cell filters:
Gene filters: min_cells = 0; excludes =
The dimension table for the Seurat object. The table contains the number of cells and genes before and after QC.
| Before_Cell_QC | 21485 | 33538 |
| After_Cell_QC | 21485 | 33538 |
| After_Gene_QC | 21485 | 33538 |
Downloading entire data
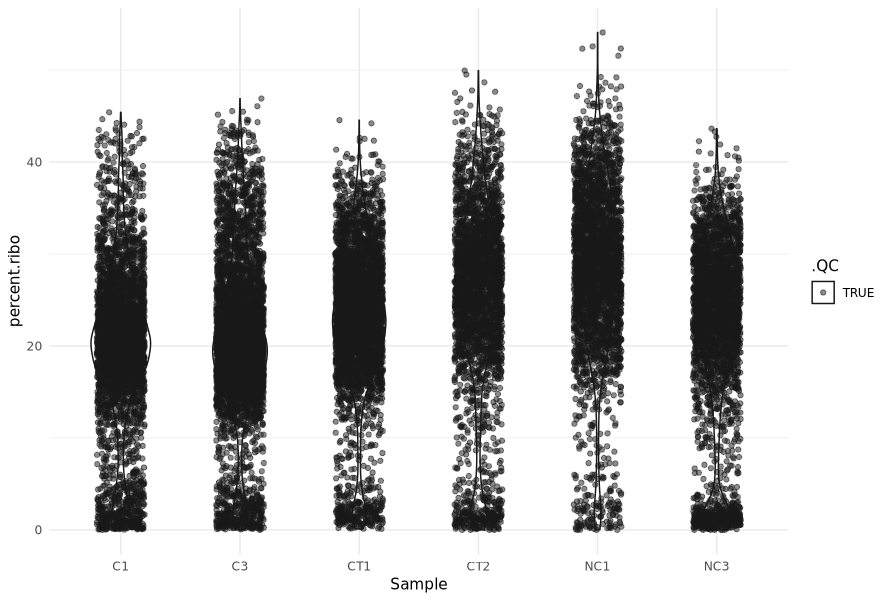
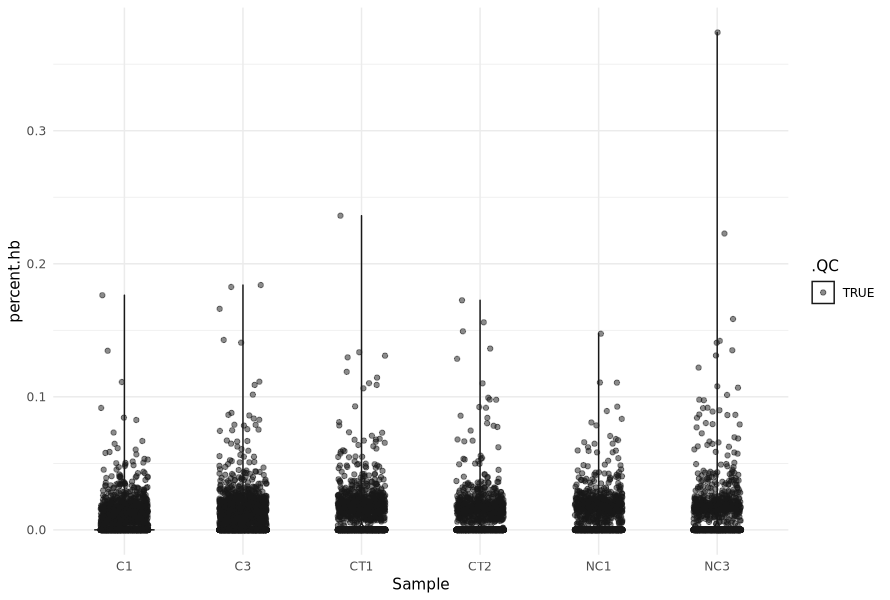
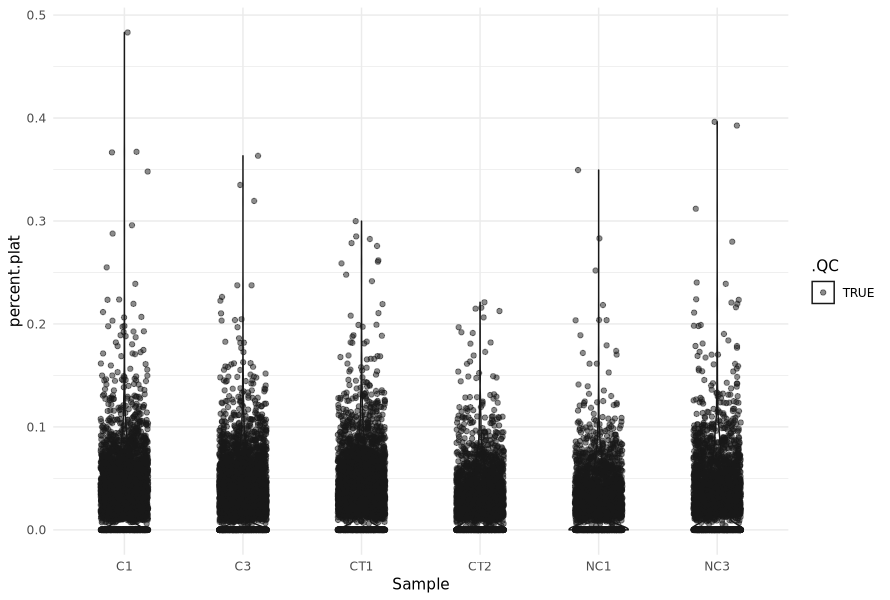
Violin Plots
The violin plots for each feature. The cells are grouped by sample. The cells that fail the QC criteria are colored in red, and the cells that pass the QC criteria are colored in black. The cells that fail the QC criteria are filtered out in the returned Seurat object.
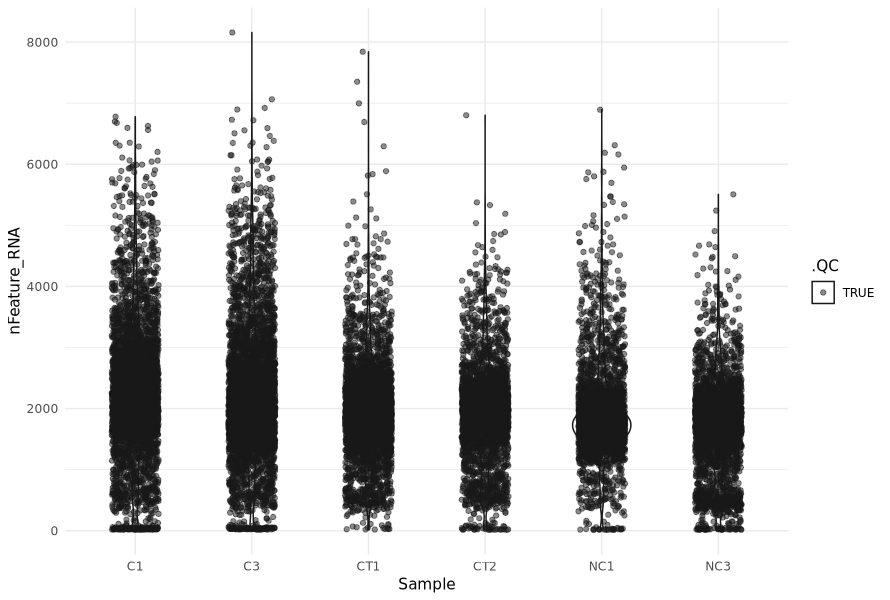
nFeature_RNA
Distribution of nFeature_RNA for each sample.Image loading error!
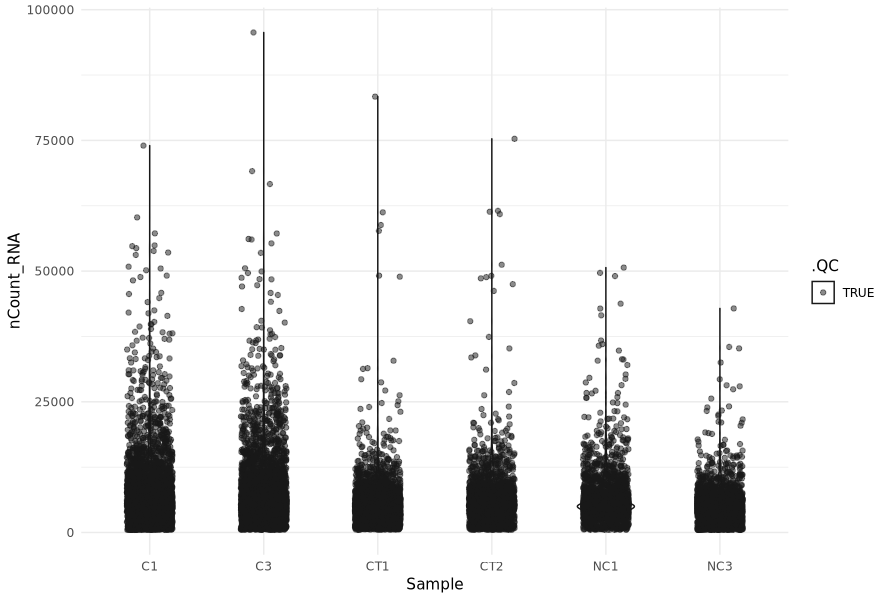
nCount_RNA
Distribution of nCount_RNA for each sample.Image loading error!
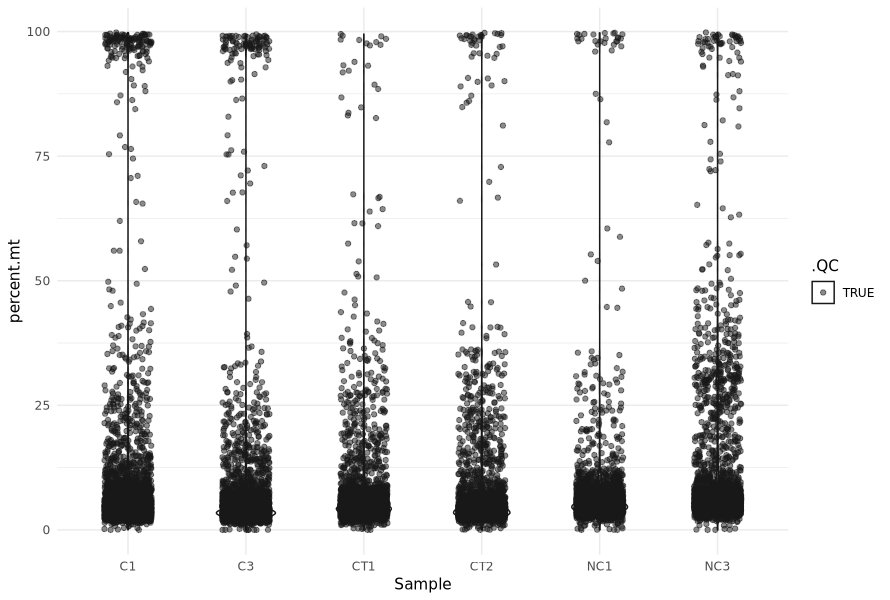
percent.mt
Distribution of percent.mt for each sample.Image loading error!
percent.ribo
Distribution of percent.ribo for each sample.Image loading error!
percent.hb
Distribution of percent.hb for each sample.Image loading error!
percent.plat
Distribution of percent.plat for each sample.Image loading error!
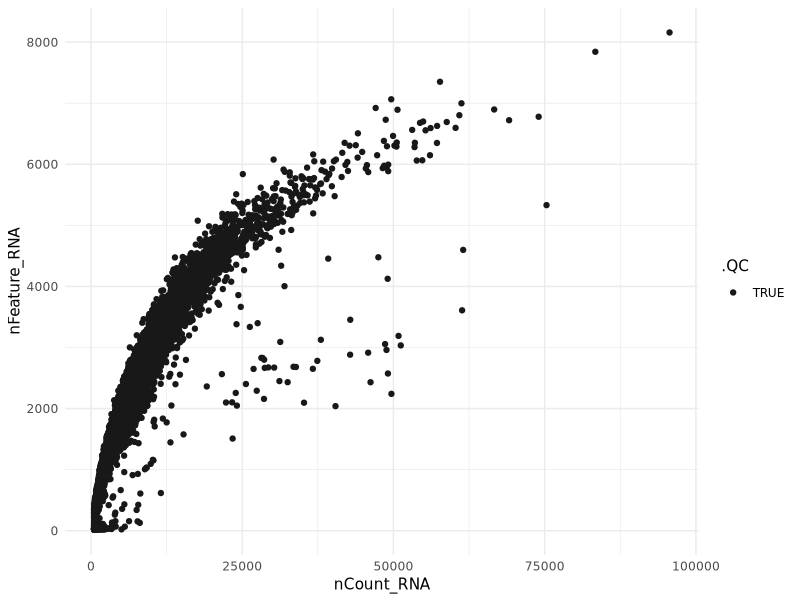
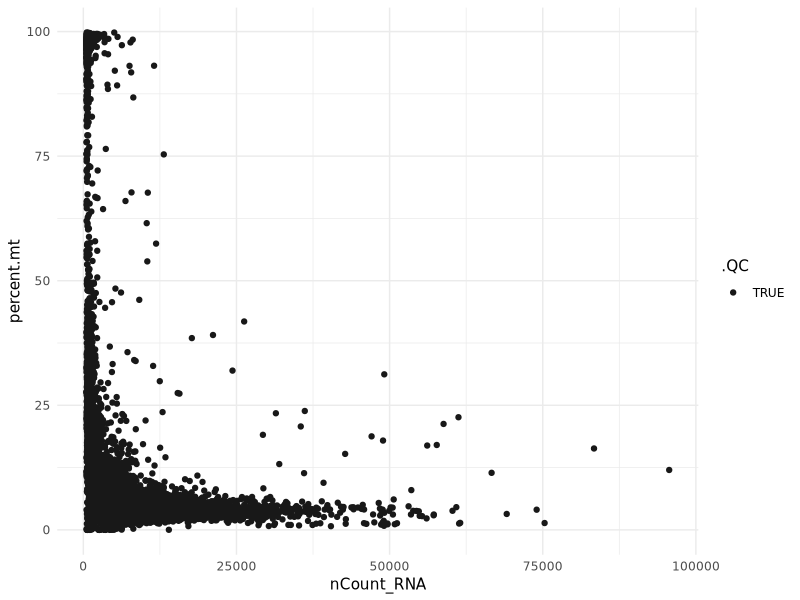
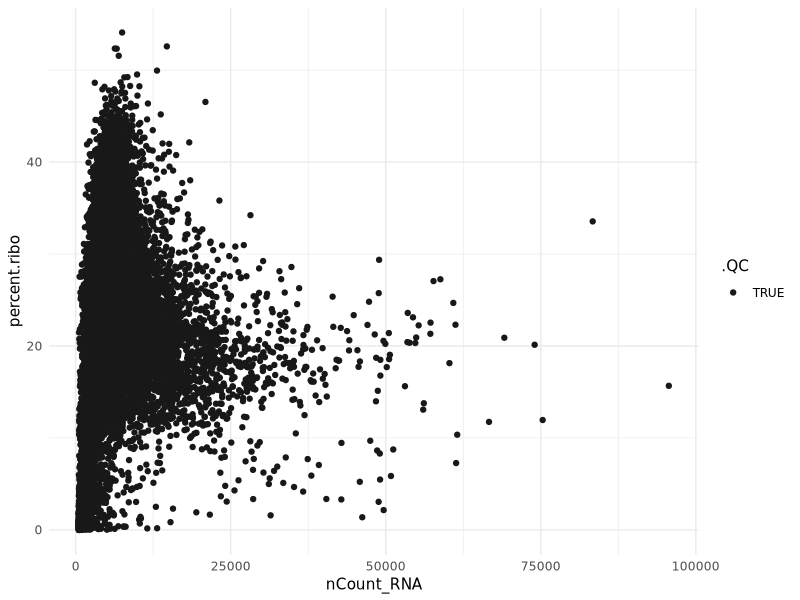
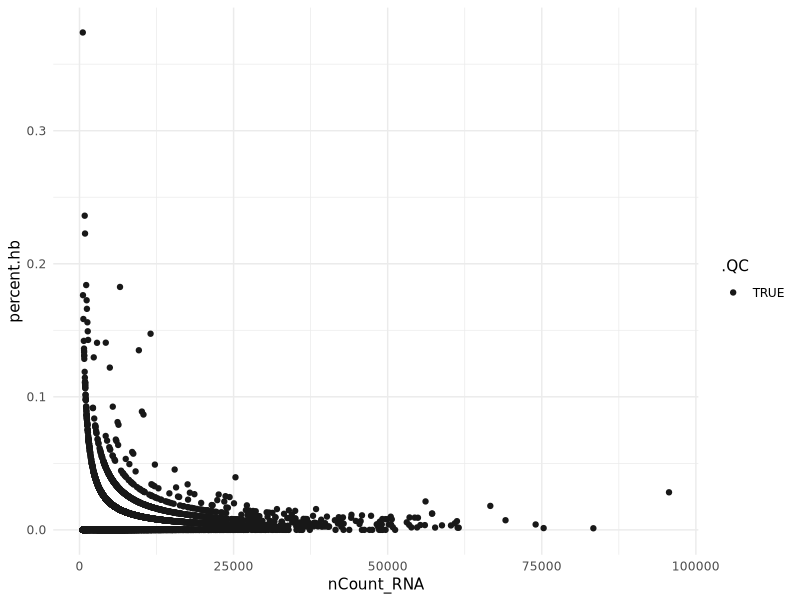
Scatter Plots
The scatter plots for each feature against nCount_RNA. The cells that fail the QC criteria are colored in red, and the cells that pass the QC criteria are colored in black. The cells that fail the QC criteria are filtered out in the returned Seurat object.
nFeature_RNA vs nCount_RNA
Scatter plot for nFeature_RNA against nCount_RNAImage loading error!
percent.mt vs nCount_RNA
Scatter plot for percent.mt against nCount_RNAImage loading error!
percent.ribo vs nCount_RNA
Scatter plot for percent.ribo against nCount_RNAImage loading error!
percent.hb vs nCount_RNA
Scatter plot for percent.hb against nCount_RNAImage loading error!
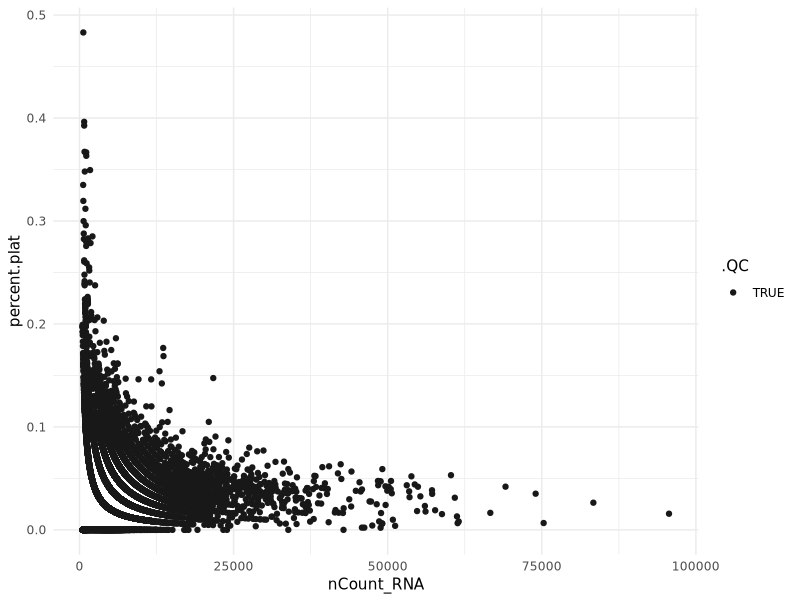
percent.plat vs nCount_RNA
Scatter plot for percent.plat against nCount_RNAImage loading error!