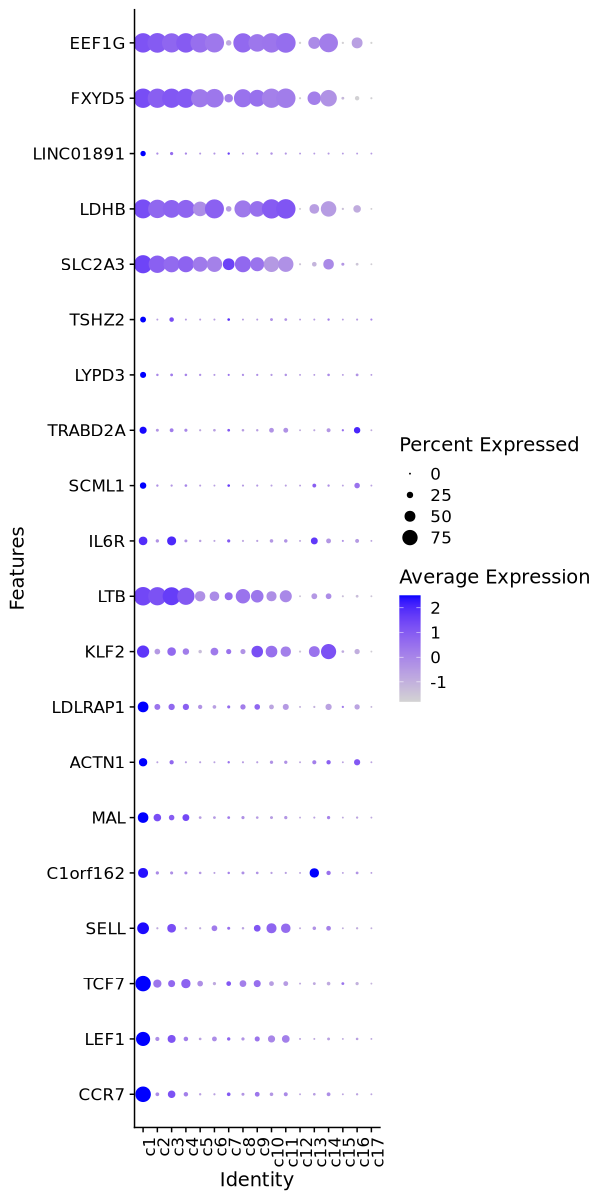
Cluster: c1
Markers
| 0 | 3.2303 | 0.762 | 0.111 | 0 | c1 | CCR7 |
| 0 | 2.8165 | 0.681 | 0.148 | 0 | c1 | LEF1 |
| 0 | 2.2969 | 0.756 | 0.241 | 0 | c1 | TCF7 |
| 0 | 2.5116 | 0.55 | 0.136 | 0 | c1 | SELL |
| 0 | 3.3802 | 0.447 | 0.05 | 0 | c1 | C1orf162 |
| 0 | 2.081 | 0.483 | 0.136 | 0 | c1 | MAL |
| 0 | 3.5092 | 0.355 | 0.035 | 0 | c1 | ACTN1 |
| 0 | 1.9606 | 0.49 | 0.171 | 0 | c1 | LDLRAP1 |
| 0 | 2.0472 | 0.577 | 0.264 | 0 | c1 | KLF2 |
| 0 | 0.9352 | 0.926 | 0.631 | 0 | c1 | LTB |
| 0 | 1.9323 | 0.371 | 0.095 | 0 | c1 | IL6R |
| 0 | 3.168 | 0.252 | 0.022 | 0 | c1 | SCML1 |
| 0 | 2.5006 | 0.289 | 0.06 | 0 | c1 | TRABD2A |
| 0 | 3.4893 | 0.23 | 0.027 | 0 | c1 | LYPD3 |
| 0 | 2.687 | 0.217 | 0.032 | 0 | c1 | TSHZ2 |
| 0 | 1.078 | 0.908 | 0.73 | 0 | c1 | SLC2A3 |
| 0 | 0.988 | 0.953 | 0.777 | 0 | c1 | LDHB |
| 0 | 2.9976 | 0.191 | 0.024 | 0 | c1 | LINC01891 |
| 0 | 0.8244 | 0.977 | 0.853 | 0 | c1 | FXYD5 |
| 0 | 0.8135 | 0.98 | 0.863 | 0 | c1 | EEF1G |
Downloading entire data
You must use "Save as" or "Save link as" from the context menu (by right-clicking the button) to download the entire data.
Enrichment Analysis
- The enrichment analysis results of the top biological pathways associated with the input gene set. Each bar represents a pathway, with the length of the bar indicating the number of input genes overlapping with genes in that pathway. The color intensity of the bars reflects the statistical significance of the enrichment (p-value).Image loading error!
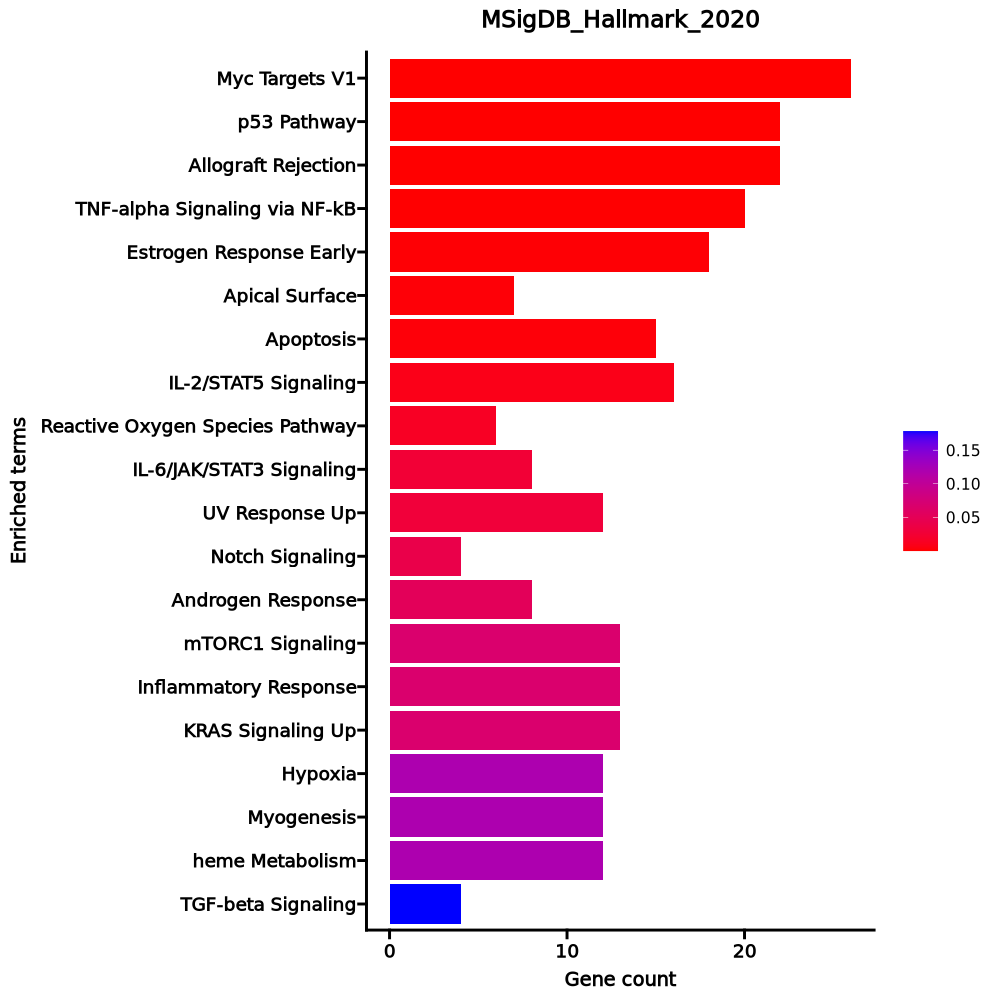
Myc Targets V1 26/200 0 0 0 0 3.5909 55.6215 RPL34;RPLP0;RPL6;HSPD1;EEF1B2;FBL;SNRPD2;C1QBP;RACK1;RPS3;RPL14;RPS2;RPL18;HNRNPA1;RPS10;NPM1;PABPC4;RPS5;CNBP;RPL22;RPS6;RSL1D1;APEX1;IMPDH2;PABPC1;EIF3D p53 Pathway 22/200 0 0.0004 0 0 2.9546 31.3582 APP;PLK3;BTG2;BTG1;PRMT2;GADD45A;DGKA;DCXR;TGFA;TOB1;LDHB;HINT1;CCND3;SOCS1;DDIT4;RPL36;RACK1;ERCC5;RPL18;ISCU;RPS12;CDK5R1 Allograft Rejection 22/200 0 0.0004 0 0 2.9546 31.3582 ITK;NPM1;RPS9;FYB1;TRAT1;IFNGR2;ITGB2;IL16;RPS3A;CFP;RPL9;IL27RA;CCND3;CD4;CD40LG;SOCS1;RPS19;CD28;APBB1;LTB;RPL39;EIF3D TNF-alpha Signaling via NF-kB 20/200 0.0002 0.0026 0 0 2.6492 22.4224 BTG2;TNFAIP8;BTG1;GADD45A;IFNGR2;ZBTB10;SLC2A3;SOD2;PNRC1;KLF2;EIF1;EFNA1;SOCS3;SNN;GPR183;F2RL1;DENND5A;SGK1;IL6ST;JUNB Estrogen Response Early 18/200 0.0015 0.0144 0 0 2.352 15.3446 SVIL;FCMR;BCL11B;MINDY1;ASB13;ADD3;AQP3;TOB1;IGF1R;SEC14L2;TIAM1;UGCG;ABLIM1;KRT18;MAPT;IL6ST;RETREG1;FKBP5 Apical Surface 7/44 0.0019 0.0155 0 0 4.4719 28.0355 APP;GSTM3;CRYBG1;HSPB1;MAL;LYPD3;DCBLD2 Apoptosis 15/161 0.0025 0.0177 0 0 2.4387 14.587 APP;BTG2;CDKN1B;GPX4;GADD45A;SATB1;LEF1;HSPB1;SOD2;PTK2;SOD1;CYLD;KRT18;SC5D;DAP3 IL-2/STAT5 Signaling 16/199 0.0078 0.0476 0 0 2.0739 10.0714 GPX4;FLT3LG;RHOH;SLC2A3;CKAP4;IGF1R;TIAM1;CCND3;SOCS1;SELL;CD48;DENND5A;ITGA6;LTB;ICOS;CCR4 Reactive Oxygen Species Pathway 6/49 0.0143 0.0779 0 0 3.2931 13.9875 PRDX2;GPX4;IPCEF1;SOD2;JUNB;SOD1 IL-6/JAK/STAT3 Signaling 8/87 0.0257 0.126 0 0 2.3913 8.7536 SOCS3;HAX1;SOCS1;IFNGR2;STAT3;LTB;IL6ST;IL17RA UV Response Up 12/158 0.0289 0.1287 0 0 1.9437 6.8895 PPP1R2;CCND3;BTG2;EIF2S3;BTG1;PLCL1;IL6ST;SOD2;AQP3;JUNB;TUBA4A;GRINA Notch Signaling 4/32 0.0401 0.1638 0 0 3.3658 10.8237 MAML2;DTX1;PRKCA;SKP1 Androgen Response 8/100 0.0521 0.1963 0 0 2.052 6.0639 INPP4B;CCND3;TNFAIP8;ACTN1;ZBTB10;SGK1;PIAS1;FKBP5 mTORC1 Signaling 13/200 0.0672 0.2058 0 0 1.6425 4.4353 BTG2;ITGB2;CXCR4;SLC2A3;CFP;ADD3;TUBA4A;HSPD1;SERP1;DDIT4;SC5D;LTA4H;PDK1 Inflammatory Response 13/200 0.0672 0.2058 0 0 1.6425 4.4353 IFITM1;BTG2;SEMA4D;IFNGR2;KCNA3;DCBLD2;ADGRE1;SELL;GPR183;LTA;CCR7;CD48;CD55 KRAS Signaling Up 13/200 0.0672 0.2058 0 0 1.6425 4.4353 ST6GAL1;GYPC;SATB1;FLT4;ITGB2;CXCR4;WNT7A;LY96;IKZF1;DCBLD2;PCSK1N;F2RL1;CD37 Hypoxia 12/200 0.1189 0.3067 0 0 1.5061 3.2069 PLAC8;EFNA1;TKTL1;KLF7;BTG1;CDKN1B;DDIT4;CXCR4;PRKCA;SLC2A3;PNRC1;PDK1 Myogenesis 12/200 0.1189 0.3067 0 0 1.5061 3.2069 EIF4A2;APP;SVIL;VIPR1;ABLIM1;PKIA;FST;FXYD1;FHL1;PDE4DIP;AEBP1;CNN3 heme Metabolism 12/200 0.1189 0.3067 0 0 1.5061 3.2069 RBM38;PRDX2;SLC25A37;BTG2;CCND3;GYPC;EPB41;MKRN1;YPEL5;AQP3;KLF3;ADD2 TGF-beta Signaling 4/54 0.1783 0.4192 0 0 1.8827 3.2468 IFNGR2;NOG;JUNB;SKIL 1–20 of 49 itemsof 3 pagesDownloading entire data
You must use "Save as" or "Save link as" from the context menu (by right-clicking the button) to download the entire data.
- The enrichment analysis results of the top biological pathways associated with the input gene set. Each bar represents a pathway, with the length of the bar indicating the number of input genes overlapping with genes in that pathway. The color intensity of the bars reflects the statistical significance of the enrichment (p-value).Image loading error!
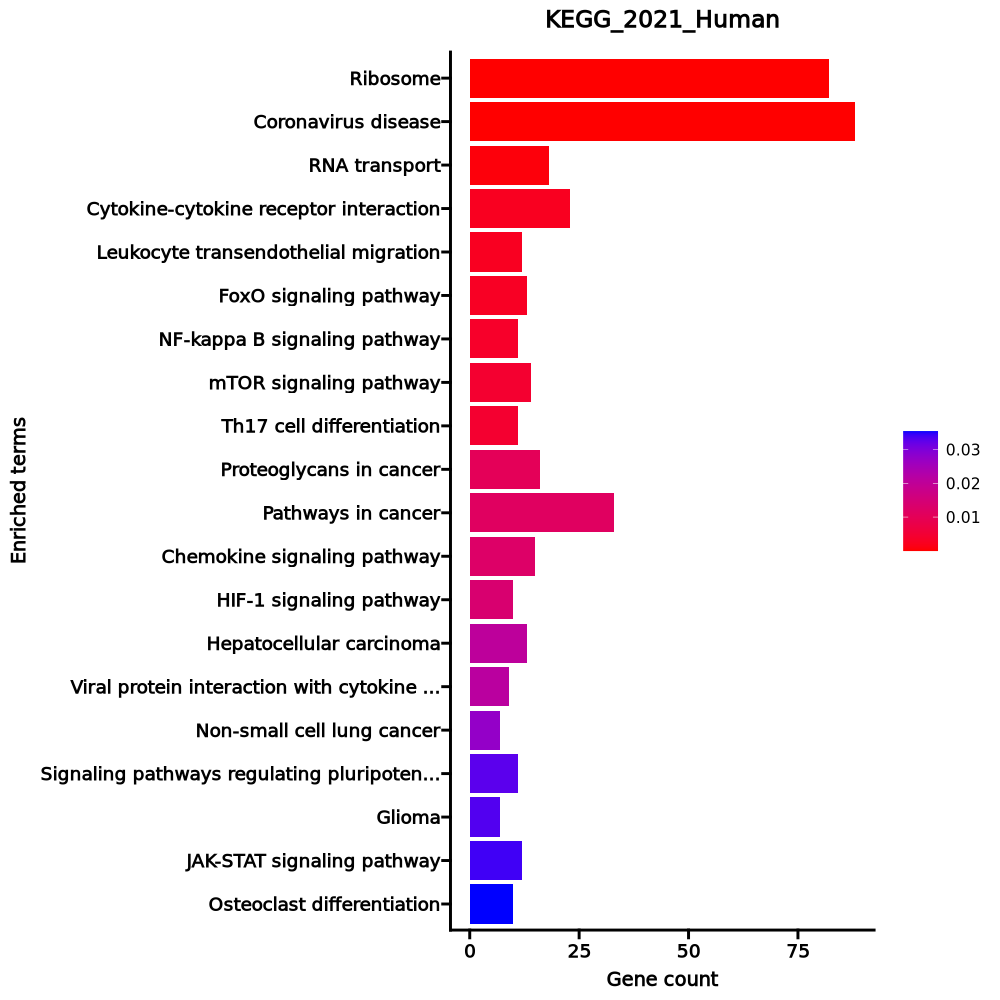
Ribosome 82/158 2.786e-71 7.132e-69 0 0 28.0482 4556.6868 RPL4;RPL5;RPL30;RPL3;RPL32;RPL31;RPL34;RPLP1;RPLP0;RPL10A;RPL8;RPL9;RPL6;RPL7;RPS15;RPS4X;RPS14;RPL7A;RPS17;RPS16;RPL18A;RPS19;RPL36AL;RPS18;RPL36;RPL35;RPLP2;RPL38;RPL37;RPS11;RPL39;RPS10;RPS13;RPS12;RPS9;RPL21;RPS7;RPS8;RPL23;RPS5;RPL22;RPS6;RPL13A;RPSA;RPS3A;RPL37A;RPL24;RPL27;RPL26;RPL29;RPL28;UBA52;RPL10;RPL12;RPL11;RPL36A;RPS4Y1;RPS15A;RPL14;RPS3;RPL13;RPL15;RPS2;RPL18;RPS27A;RPL17;RPL19;RPL41;RPL35A;RPL23A;RPS26;RPS25;RPS28;RPS27;RPS29;RPL27A;RPS20;FAU;RPS21;RSL24D1;RPS24;RPS23 Coronavirus disease 88/232 1.11e-61 1.421e-59 0 0 15.9601 2240.0619 RPL4;RPL5;RPL30;RPL3;RPL32;RPL31;RPL34;RPLP1;RPLP0;PIK3CB;RPL8;RPL10A;RPL9;RPL6;RPL7;RPS15;RPS4X;RPS14;RPL7A;RPS17;RPS16;RPL18A;RPS19;RPL36AL;RPS18;RPL36;RPL35;RPLP2;RPL38;RPL37;RPS11;RPL39;RPS10;IL6R;RPS13;RPS12;RPS9;RPL21;RPS7;RPS8;RPL23;RPS5;RPL22;RPS6;RPL13A;PRKCA;RPSA;RPS3A;RPL37A;RPL24;RPL27;RPL26;RPL29;IL6ST;RPL28;UBA52;RPL10;RPL12;RPL11;RPL36A;RPS4Y1;RPS15A;RPL14;RPS3;RPL13;RPL15;RPS2;RPL18;RPS27A;RPL17;RPL19;RPL41;MX2;STAT3;RPL35A;RPL23A;RPS26;RPS25;RPS28;RPS27;RPS29;RPL27A;RPS20;FAU;RPS21;RSL24D1;RPS24;RPS23 RNA transport 18/186 0.0006 0.0542 0 0 2.5498 18.7714 EIF4A2;PABPC4;THOC3;EIF1;EEF1A1;EIF2S3;NUP50;RPP21;EIF3G;TACC3;EIF3H;EIF4EBP3;EIF3E;PABPC1;EIF3F;EIF1B;EIF3D;EIF4B Cytokine-cytokine receptor interaction 23/295 0.0024 0.1176 0 0 2.014 12.1446 GDF10;EDA;IFNGR2;CXCR5;CXCR4;IL16;TNFRSF10A;IL27RA;IL17RA;TNFRSF10D;TGFBR2;EDAR;CD4;CD40LG;ACVR1C;LTA;CD27;TNFSF8;CCR7;LTB;IL6ST;CCR4;IL6R Leukocyte transendothelial migration 12/114 0.0024 0.1176 0 0 2.7886 16.7966 ITK;NCF1;ACTN1;TXK;PXN;ITGB2;RHOH;CXCR4;PRKCA;PIK3CB;ARHGAP5;PTK2 FoxO signaling pathway 13/131 0.0028 0.1176 0 0 2.6124 15.3968 PLK3;CDKN1B;GADD45A;BNIP3;STAT3;PIK3CB;SOD2;KLF2;IGF1R;TGFBR2;S1PR1;ATM;SGK1 NF-kappa B signaling pathway 11/104 0.0035 0.1232 0 0 2.8014 15.8585 EDAR;CYLD;EDA;CD40LG;GADD45A;LTA;LY96;ATM;ERC1;LTB;LAT mTOR signaling pathway 14/154 0.0043 0.1232 0 0 2.3715 12.9155 ATP6V1G1;WNT10A;RPS6;FZD6;WNT7A;PRKCA;PIK3CB;IGF1R;LRP6;DDIT4;GRB10;ULK2;SGK1;EIF4B Th17 cell differentiation 11/107 0.0043 0.1232 0 0 2.7135 14.7663 CD4;IFNGR2;STAT3;NFATC1;IL6ST;IL6R;JAK3;LAT;IL27RA;RUNX1;TGFBR2 Proteoglycans in cancer 16/205 0.0102 0.261 0 0 2.0074 9.2061 WNT10A;DDX5;FZD6;STAT3;RPS6;PXN;WNT7A;PRKCA;ANK3;PIK3CB;PTK2;IGF1R;TIAM1;TFAP4;CTSL;EIF4B Pathways in cancer 33/531 0.0114 0.2653 0 0 1.5793 7.0657 CDKN1B;MAX;FLT4;TCF7;LEF1;TGFA;CXCR4;PIK3CB;RASGRP2;LRP6;IGF1R;CCND3;GNG7;PIM2;JAK3;IL6R;SKP1;ARHGEF11;GSTM3;WNT10A;GADD45A;IFNGR2;FZD6;STAT3;WNT7A;FLT3LG;PRKCA;PTK2;RUNX1;TGFBR2;LPAR6;ITGA6;IL6ST Chemokine signaling pathway 15/192 0.0125 0.2666 0 0 2.0083 8.8014 ITK;NCF1;PXN;STAT3;CXCR5;CXCR4;PIK3CB;RASGRP2;PTK2;TIAM1;GNG7;GRK6;CCR7;CCR4;JAK3 HIF-1 signaling pathway 10/109 0.0137 0.2707 0 0 2.3887 10.2405 LDHB;CDKN1B;IFNGR2;RPS6;STAT3;PRKCA;PIK3CB;IL6R;IGF1R;PDK1 Hepatocellular carcinoma 13/168 0.0206 0.3605 0 0 1.9849 7.7074 GSTM3;WNT10A;GADD45A;TCF7;FZD6;LEF1;TGFA;WNT7A;PRKCA;PIK3CB;IGF1R;TGFBR2;LRP6 Viral protein interaction with cytokine and cytokine receptor 9/100 0.0211 0.3605 0 0 2.3369 9.0141 LTA;CXCR5;CXCR4;TNFRSF10A;CCR7;IL6ST;IL6R;CCR4;TNFRSF10D Non-small cell lung cancer 7/72 0.0274 0.4384 0 0 2.5418 9.1433 GADD45A;STAT3;TGFA;PRKCA;PIK3CB;JAK3;FHIT Signaling pathways regulating pluripotency of stem cells 11/143 0.0327 0.4531 0 0 1.9697 6.7353 WNT10A;ACVR1C;TCF7;FZD6;STAT3;WNT7A;PIK3CB;IL6ST;SKIL;JAK3;IGF1R Glioma 7/75 0.0333 0.4531 0 0 2.4293 8.2653 CAMK1D;GADD45A;CAMK4;TGFA;PRKCA;PIK3CB;IGF1R JAK-STAT signaling pathway 12/162 0.0341 0.4531 0 0 1.8915 6.3902 SOCS3;CCND3;SOCS1;IFNGR2;FHL1;STAT3;PIK3CB;IL6ST;IL6R;JAK3;IL27RA;PIAS1 Osteoclast differentiation 10/127 0.0354 0.4531 0 0 2.0193 6.7467 SOCS3;CYLD;SOCS1;NCF1;IFNGR2;CAMK4;NFATC1;PIK3CB;JUNB;TGFBR2 1–20 of 256 itemsof 13 pagesDownloading entire data
You must use "Save as" or "Save link as" from the context menu (by right-clicking the button) to download the entire data.
Cluster: c2
Markers
| 0 | 1.7197 | 0.786 | 0.258 | 0 | c2 | CD40LG |
| 0 | 1.2678 | 0.936 | 0.479 | 0 | c2 | KLRB1 |
| 0 | 1.5502 | 0.779 | 0.337 | 0 | c2 | LGALS3 |
| 0 | 1.4112 | 0.983 | 0.564 | 0 | c2 | ANXA1 |
| 0 | 1.1126 | 0.72 | 0.33 | 0 | c2 | AQP3 |
| 0 | 1.1958 | 0.989 | 0.619 | 0 | c2 | IL7R |
| 0 | 1.4977 | 0.511 | 0.16 | 0 | c2 | CCR6 |
| 0 | 2.0047 | 0.542 | 0.204 | 0 | c2 | TNF |
| 0 | 1.51 | 0.951 | 0.617 | 0 | c2 | FOSB |
| 0 | 1.8661 | 0.461 | 0.148 | 0 | c2 | AC020571.1 |
| 0 | 1.0314 | 0.931 | 0.652 | 0 | c2 | S100A11 |
| 0 | 2.449 | 0.344 | 0.068 | 0 | c2 | TNFSF13B |
| 0 | 2.1458 | 0.358 | 0.089 | 0 | c2 | IL2 |
| 0 | 1.1223 | 0.993 | 0.757 | 0 | c2 | S100A4 |
| 0 | 3.0729 | 0.236 | 0.032 | 0 | c2 | IL4I1 |
| 0 | 1.4649 | 0.94 | 0.744 | 0 | c2 | JUN |
| 0 | 2.5141 | 0.216 | 0.03 | 0 | c2 | IL23R |
| 0 | 1.3438 | 0.997 | 0.82 | 0 | c2 | FOS |
| 0 | 1.0264 | 0.996 | 0.853 | 0 | c2 | VIM |
| 0 | 1.1083 | 0.995 | 0.879 | 0 | c2 | DUSP1 |
Downloading entire data
You must use "Save as" or "Save link as" from the context menu (by right-clicking the button) to download the entire data.
Enrichment Analysis
- The enrichment analysis results of the top biological pathways associated with the input gene set. Each bar represents a pathway, with the length of the bar indicating the number of input genes overlapping with genes in that pathway. The color intensity of the bars reflects the statistical significance of the enrichment (p-value).Image loading error!
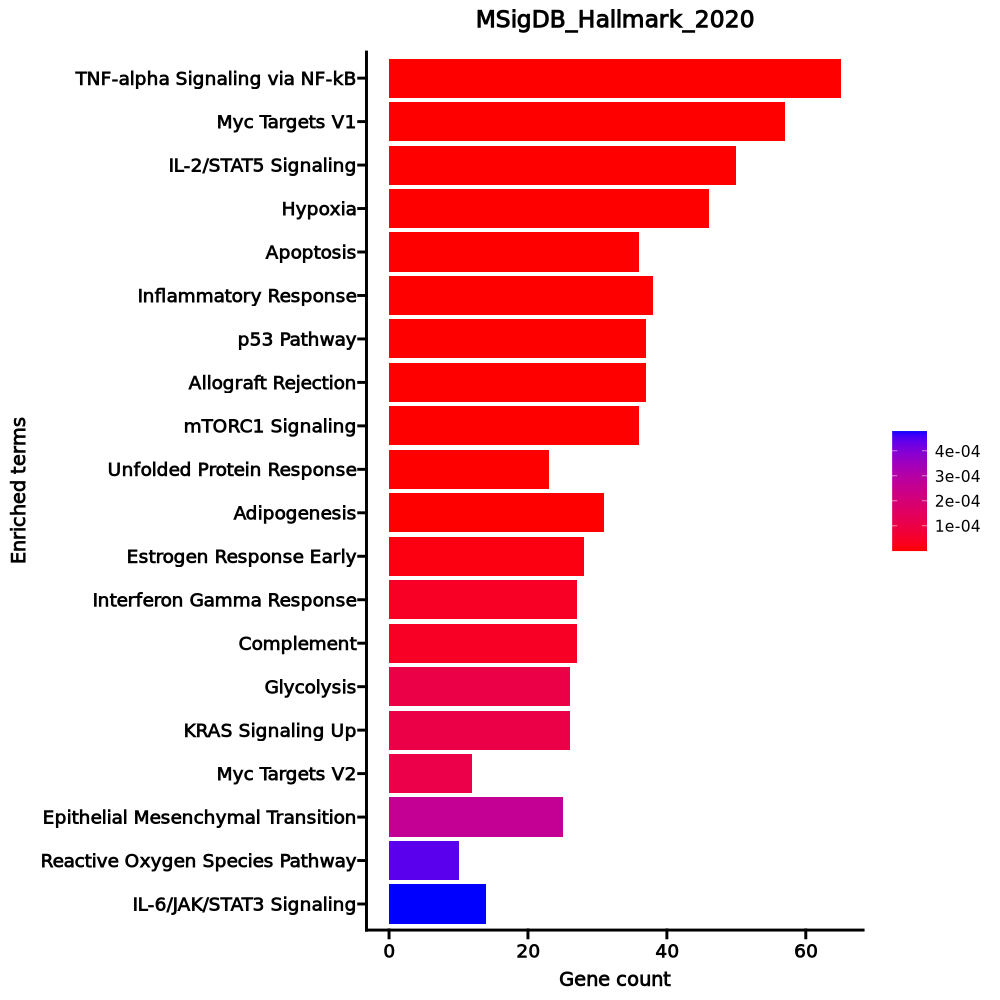
TNF-alpha Signaling via NF-kB 65/200 1.841e-31 9.206e-30 0 0 8.1852 579.2631 BTG2;CDKN1A;TNFAIP8;BTG1;CD83;CSF2;CSF1;TNFAIP3;IRS2;SLC2A3;AREG;TNF;ZFP36;MYC;ZC3H12A;PHLDA2;JUNB;IER5;PHLDA1;IER2;KDM6B;KLF10;DUSP1;IFNGR2;PLAUR;FOS;TUBB2A;IL23A;SIK1;ATF3;TLR2;PTGER4;PPP1R15A;PFKFB3;BCL2A1;TANK;SOCS3;MCL1;ABCA1;EGR1;JUN;EGR2;EGR3;SMAD3;GADD45B;TIPARP;CCL20;PLK2;GFPT2;KLF4;NFKB1;PNRC1;EIF1;NFKBIA;NR4A2;NR4A1;KLF6;NR4A3;TNIP1;GPR183;BHLHE40;F2RL1;FOSB;CD69;IL7R Myc Targets V1 57/200 1.818e-24 4.545e-23 0 0 6.7244 367.5861 EIF4A1;HSP90AB1;RPL34;RPLP0;RPL6;EEF1B2;SYNCRIP;FBL;YWHAQ;MYC;C1QBP;SNRPD3;RPS10;DDX18;CCT2;PABPC4;RPS5;RPL22;RPS6;ILF2;GNL3;CANX;VDAC3;NHP2;PPIA;GLO1;NOLC1;DDX21;PHB;SRM;LDHA;PRDX4;PCBP1;G3BP1;POLD2;RPS3;RPL14;PGK1;RPS2;RPL18;CCT7;CCT5;CCT4;XRCC6;NPM1;SF3A1;SSB;PTGES3;CNBP;PA2G4;HSPE1;RSL1D1;LSM7;APEX1;IMPDH2;ABCE1;EIF4G2 IL-2/STAT5 Signaling 50/199 5.088e-19 8.48e-18 0 0 5.6237 236.8846 CYFIP1;RNH1;CD83;CSF2;CSF1;GPR65;RORA;SLC2A3;AHR;PNP;CCND2;GLIPR2;CA2;MYC;NFKBIZ;TNFSF10;PIM1;SLC39A8;TNFRSF4;PHLDA1;CISH;GPX4;IFNGR1;FLT3LG;EMP1;ADAM19;ARL4A;RRAGD;COL6A1;CD48;PLIN2;LTB;AHNAK;PTGER2;CAPG;SLC1A5;NDRG1;SOCS2;NT5E;ICOS;PRNP;XBP1;GADD45B;FAH;DHRS3;HIPK2;KLF6;BHLHE40;BCL2;IL18R1 Hypoxia 46/200 5.251e-16 0 0 0 4.9866 175.4445 PPP1R15A;SRPX;CDKN1A;BTG1;PFKFB3;CITED2;CXCR4;TNFAIP3;IRS2;RORA;SLC2A3;ENO1;VLDLR;ENO2;NDRG1;PLAC8;LDHA;ZFP36;FAM162A;MXI1;PIM1;PGK1;IDS;TPD52;JUN;ANXA2;CAVIN1;HSPA5;TIPARP;DUSP1;IGFBP3;TPBG;PLAUR;B3GALT6;MIF;FOS;AMPD3;PNRC1;KLF6;DDIT4;RRAGD;BHLHE40;BCL2;PLIN2;S100A4;ATF3 Apoptosis 36/161 0 0 0 0 4.7728 128.6952 APP;CDKN1A;BTG2;SATB1;HSPB1;PLAT;ENO2;TNF;CLU;LGALS3;GNA15;CCND2;LMNA;TNFSF10;CASP1;TSPO;TIMP1;MCL1;BCAP31;JUN;EGR3;ANXA1;GADD45B;GPX4;IFNGR1;F2R;EMP1;CD2;DNAJA1;DPYD;PPT1;RARA;PDCD4;TXNIP;CD69;ATF3 Inflammatory Response 38/200 0 0 0 0 3.8865 90.043 PTGER4;IFITM1;CDKN1A;BTG2;CSF1;CD82;PTGER2;GNAI3;KCNA3;AHR;SRI;GNA15;IL18RAP;MYC;C3AR1;TNFSF10;PROK2;NLRP3;TIMP1;SLAMF1;ABCA1;SLC31A2;CCL20;IFNGR2;TPBG;OSM;PLAUR;EMP3;NFKB1;NFKBIA;KLF6;GPR183;CD48;CD69;ITGA5;IL7R;IL18R1;TLR2 p53 Pathway 37/200 0 0 0 0 3.7575 81.9381 PPP1R15A;APP;CDKN1A;BTG2;BTG1;CD82;NDRG1;ZFP36L1;SEC61A1;CCND2;FAM162A;PERP;SESN1;RPL36;CASP1;STOM;RPL18;IER5;RPS12;S100A10;ZNF365;PHLDA3;PLK3;JUN;TGFB1;PLK2;ZBTB16;F2R;FOS;KLF4;BAIAP2;VAMP8;MAPKAPK3;DDIT4;TXNIP;S100A4;ATF3 Allograft Rejection 37/200 0 0 0 0 3.7575 81.9381 DYRK3;CSF1;GPR65;NCF4;CAPG;THY1;CFP;RPL9;TNF;HDAC9;MRPL3;CCND2;IL18RAP;RPS19;STAT4;NLRP3;TIMP1;RPL39;CCR2;TPD52;EIF5A;NPM1;RPS9;TGFB1;IFNGR1;TRAT1;IFNGR2;F2R;RPS3A;IL2;CD2;CD4;CD40LG;DEGS1;LTB;ABCE1;TLR2 mTORC1 Signaling 36/200 0 0 0 0 3.6302 74.3406 PPP1R15A;CDKN1A;BTG2;FKBP2;RPN1;CXCR4;SLC2A3;ENO1;VLDLR;SLC1A5;CFP;UNG;HSP90B1;LDHA;PNP;SERP1;PSMB5;PRDX1;PGK1;ME1;SSR1;XBP1;EGLN3;HSPA5;M6PR;ELOVL6;HSPE1;TUBA4A;QDPR;UFM1;PPA1;DDIT4;CANX;BHLHE40;PPIA;SKAP2 Unfolded Protein Response 23/113 0 0 0 0 4.1947 66.8279 EIF4A2;EIF4A1;XBP1;NPM1;HSPA5;EIF4A3;NOLC1;EEF2;SDAD1;YWHAZ;HSP90B1;ERN1;RPS14;SPCS3;SERP1;TUBB2A;BAG3;DDIT4;NHP2;SSR1;SRPRB;DNAJB9;ATF3 Adipogenesis 31/200 0 0 0 0 3.0193 43.3417 RTN3;SLC27A1;RNF11;ACAA2;PFKFB3;NDUFB7;MGST3;UQCR11;SLC1A5;LTC4S;TANK;GRPEL1;UBC;ME1;STOM;DNAJB9;ABCA1;CAVIN1;GPX4;IFNGR1;ELOVL6;FAH;QDPR;DHRS7;ARL4A;REEP5;CAT;CMPK1;PDCD4;PLIN2;ESYT1 Estrogen Response Early 28/200 0 0.0001 0 0 2.6721 29.7192 NXT1;TMPRSS3;ISG20L2;AQP3;AREG;SEC14L2;MYC;RRP12;MYBL1;KLF10;XBP1;EGR3;CISH;TIPARP;DYNLT3;TPBG;FOS;KLF4;DHRS3;MYBBP1A;BHLHE40;RARA;BCL2;UNC119;BLVRB;NBL1;RETREG1;TJP3 Interferon Gamma Response 27/200 0 0.0001 0 0 2.5594 25.9093 LGALS3BP;CDKN1A;IFITM2;BTG1;CFH;SECTM1;TNFAIP3;SRI;IFI44L;IL18BP;SOCS3;PNP;TNFSF10;STAT4;PIM1;CASP1;RSAD2;MX2;LYSMD2;IFI44;NFKB1;VAMP8;NFKBIA;ARL4A;LATS2;TXNIP;CD69 Complement 27/200 0 0.0001 0 0 2.5594 25.9093 CFH;CPQ;GNAI3;TNFAIP3;PLAT;PRCP;GATA3;LIPA;CLU;DPP4;LGALS3;CA2;SPOCK2;PIM1;CASP1;ME1;CTSH;TIMP1;SH2B3;CTSB;CR1;HSPA5;PLAUR;DUSP6;CD40LG;CALM1;HSPA1A Glycolysis 26/200 0.0001 0.0003 0 0 2.4481 22.4384 CITED2;CXCR4;IRS2;ENO1;TXN;VLDLR;ENO2;GMPPB;LDHA;NT5E;FAM162A;MXI1;PGK1;ME1;CYB5A;EGLN3;HSPA5;IGFBP3;TPBG;B3GALT6;MIF;HAX1;GNPDA1;DDIT4;RRAGD;PPIA KRAS Signaling Up 26/200 0.0001 0.0003 0 0 2.4481 22.4384 PPP1R15A;SPON1;CSF2;CFH;SATB1;CXCR4;TNFAIP3;PLAT;HDAC9;CCND2;KIF5C;CA2;C3AR1;PLEK2;MPZL2;CCL20;IGFBP3;GFPT2;LAPTM5;PLAUR;EMP1;KLF4;DUSP6;F2RL1;LCP1;IL7R Myc Targets V2 12/58 0.0001 0.0003 0 0 4.2511 38.9023 DDX18;NPM1;MYBBP1A;MYC;NOLC1;RRP12;PHB;PA2G4;HSPE1;GNL3;SRM;UNG Epithelial Mesenchymal Transition 25/200 0.0003 0.0007 0 0 2.3383 19.2906 HTRA1;PLOD3;TNFAIP3;CAPG;THY1;ENO2;AREG;FBLN5;NT5E;LGALS1;TIMP1;IL32;JUN;TGFB1;GADD45B;IGFBP3;PLAUR;EMP3;COL5A3;ADAM12;ITGA5;VIM;PPIB;FERMT2;MATN2 Reactive Oxygen Species Pathway 10/49 0.0004 0.0012 0 0 4.1727 32.2227 CDKN2D;PRDX2;PRNP;PRDX4;GPX4;PRDX1;CAT;TXN;GCLM;JUNB IL-6/JAK/STAT3 Signaling 14/87 0.0005 0.0012 0 0 3.1261 23.8991 JUN;CSF2;TGFB1;CSF1;IFNGR1;IFNGR2;TNF;SOCS3;HAX1;PIM1;LTB;IL9R;IL18R1;TLR2 1–20 of 50 itemsof 3 pagesDownloading entire data
You must use "Save as" or "Save link as" from the context menu (by right-clicking the button) to download the entire data.
- The enrichment analysis results of the top biological pathways associated with the input gene set. Each bar represents a pathway, with the length of the bar indicating the number of input genes overlapping with genes in that pathway. The color intensity of the bars reflects the statistical significance of the enrichment (p-value).Image loading error!
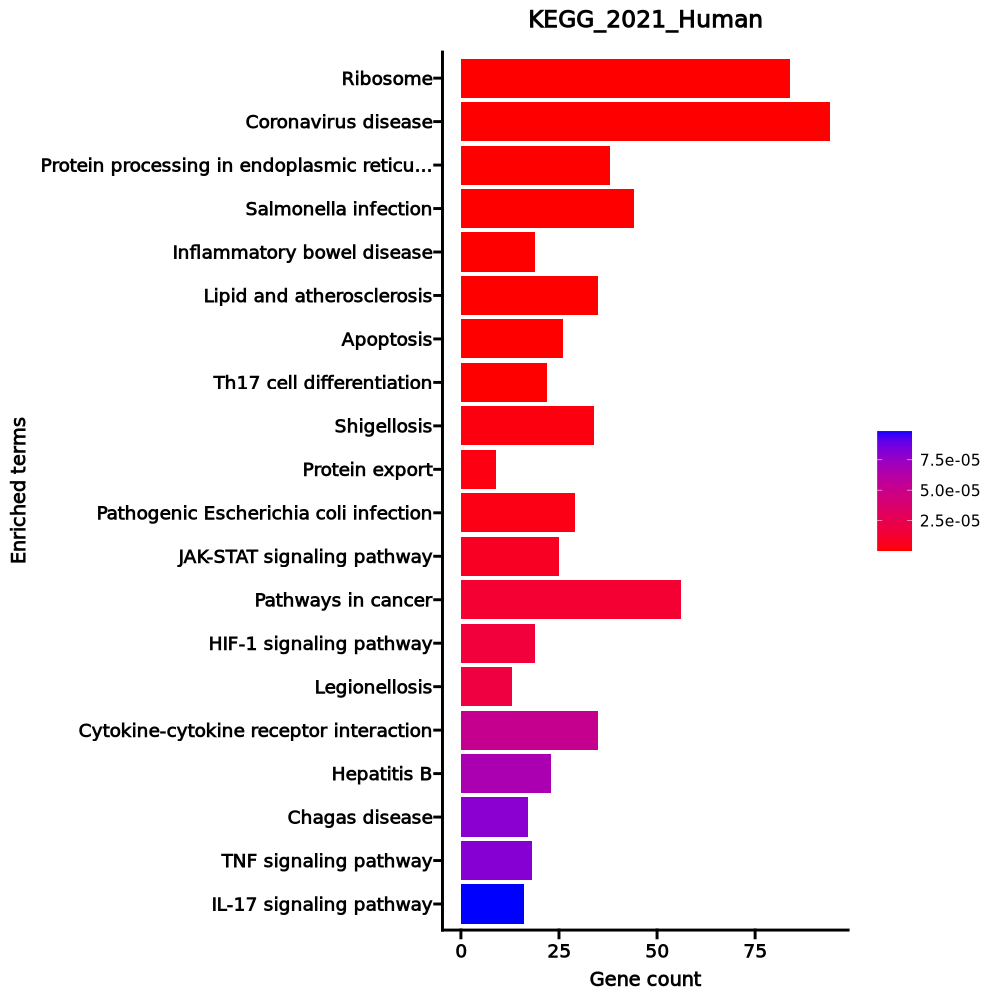
Ribosome 84/158 3.008e-61 8.784e-59 0 0 19.7005 2745.3929 RPL4;RPL5;RPL30;RPL3;RPL32;RPL31;RPL34;RPLP1;RPLP0;RPL10A;RPL8;RPL9;RPL6;RPL7;RPS15;RPS4X;RPS14;MRPL3;RPL7A;RPS17;RPS16;RPL18A;RPS19;RPL36AL;RPS18;RPL36;RPL35;RPLP2;RPL38;RPL37;RPL39;RPS10;RPS13;RPS12;RPS9;RPL21;RPS7;RPS8;RPL23;RPS5;RPL22;RPS6;RPL13A;RPSA;RPS3A;RPL37A;RPL24;RPL27;RPL26;RPL29;RPL28;UBA52;RPL10;MRPL18;RPL12;RPL11;RPL36A;RPS4Y1;RPS15A;RPL14;RPS3;RPL13;RPL15;RPS2;RPL18;RPS27A;RPL17;RPL19;RPL41;RPL35A;RPL23A;MRPL24;RPS26;RPS25;RPS28;RPS27;RPS29;RPL27A;RPS20;RPL22L1;FAU;RPS21;RPS24;RPS23 Coronavirus disease 94/232 6.437e-55 9.397e-53 0 0 11.8914 1483.8052 RPL4;RPL5;RPL30;RPL3;CSF2;RPL32;RPL31;RPL34;RPLP1;RPLP0;PIK3CB;RPL8;RPL10A;RPL9;TNF;RPL6;RPL7;RPS15;RPS4X;RPS14;RPL7A;RPS17;RPS16;RPL18A;RPS19;RPL36AL;RPS18;C3AR1;RPL36;CASP1;RPL35;RPLP2;RPL38;RPL37;RPL39;RPS10;RPS13;RPS12;RPS9;RPL21;RPS7;RPS8;RPL23;RPS5;RPL22;RPS6;RPL13A;RPSA;RPS3A;FOS;RPL37A;RPL24;RPL27;RPL26;RPL29;RPL28;UBA52;TLR2;RPL10;RPL12;RPL11;RPL36A;RPS4Y1;RPS15A;RPL14;RPS3;RPL13;NLRP3;RPL15;RPS2;RPL18;RPS27A;RPL17;RPL19;JUN;RPL41;MX2;RPL35A;RPL23A;IL2;NFKB1;RPS26;NFKBIA;RPS25;RPS28;RPS27;RPS29;RPL27A;RPS20;RPL22L1;FAU;RPS21;RPS24;RPS23 Protein processing in endoplasmic reticulum 38/171 0 0 0 0 4.7413 133.5713 PPP1R15A;TRAM1;HSP90AB1;RPN2;RPN1;HSP90B1;SEC61A1;DNAJB1;SEC61G;LMAN2;CAPN2;SSR1;SEC61B;SEC62;UBQLN4;SKP1;PDIA3;BCAP31;HSPA8;XBP1;HSP90AA1;SEC13;HSPA5;SSR4;SSR2;SSR3;SVIP;DDOST;PDIA4;ERN1;DNAJA1;DAD1;CANX;BCL2;STT3A;P4HB;HSPA1B;HSPA1A Salmonella infection 44/249 0 0 0 0 3.567 85.812 CYFIP1;ARF1;HSP90AB1;AHNAK;TRADD;TXN;PIK3CB;TNF;MYL12A;MYL12B;HSP90B1;CDC42;CYTH3;TUBA1C;CYTH2;TUBA1B;TUBA1A;KIF5C;MYC;AKT3;TNFSF10;RPS3;CASP1;NLRP3;RILP;SKP1;S100A10;JUN;MAP2K1;HSP90AA1;ANXA2;DYNLT3;M6PR;TNFRSF10B;FOS;TUBB4B;TUBA4A;NFKB1;NFKBIA;TUBB2A;BCL2;CYCS;ARF6;TLR2 Inflammatory bowel disease 19/65 0 0 0 0 6.772 133.2524 IL22;JUN;SMAD3;TGFB1;IFNGR1;IL23R;IFNGR2;RORC;RORA;GATA3;TNF;IL2;NFKB1;IL18RAP;IL23A;STAT4;IL18R1;TLR2;IL17A Lipid and atherosclerosis 35/215 0 0 0 0 3.2101 55.4231 HSP90AB1;NCF1;NCF4;VLDLR;PIK3CB;TANK;TNF;HSP90B1;CDC42;PPP3CA;AKT3;TNFSF10;CASP1;NLRP3;CAMK2G;ABCA1;HSPA8;JUN;XBP1;HSP90AA1;HSPA5;TNFRSF10B;FOS;NFKB1;ERN1;NFKBIA;PLCB3;CD40LG;BCL2;CYCS;CALM1;PLCB1;HSPA1B;TLR2;HSPA1A Apoptosis 26/142 0 0 0 0 3.6836 57.3405 BCL2A1;TRADD;PIK3CB;TNF;TUBA1C;TUBA1B;TUBA1A;AKT3;LMNA;CAPN2;TNFSF10;CTSH;MCL1;CTSB;MAP2K1;JUN;GADD45B;TNFRSF10B;FOS;PTPN13;TUBA4A;NFKB1;ERN1;NFKBIA;BCL2;CYCS Th17 cell differentiation 22/107 0 0 0 0 4.2458 65.7715 IL22;JUN;HSP90AA1;SMAD3;TGFB1;HSP90AB1;IFNGR1;IL23R;IFNGR2;RORC;RORA;AHR;GATA3;FOS;IL2;NFKB1;NFKBIA;PPP3CA;CD4;IL23A;RARA;IL17A Shigellosis 34/246 0 0.0001 0 0 2.6408 34.0498 ARF1;CSF2;TRADD;PIK3CB;TNF;MYL12A;MYL12B;CDC42;CYTH3;CYTH2;RPS6KA5;UBB;AKT3;UBC;TIFA;CAPN2;CASP1;NLRP3;RPS27A;SKP1;CAST;JUN;NFKB1;NFKBIA;RRAGA;PLCB3;TNIP1;RRAGD;BCL2;CYCS;ITGA5;PLCB1;UBA52;ARF6 Protein export 9/23 0 0.0001 0 0 10.4664 133.4299 SEC61A1;SPCS3;SPCS2;HSPA5;SEC61G;SRPRB;SEC61B;SEC62;SEC11C Pathogenic Escherichia coli infection 29/197 0 0.0001 0 0 2.8365 35.3573 CYFIP1;ARF1;TMED10;TRADD;TNF;CDC42;CYTH3;TUBA1C;CYTH2;TUBA1B;TUBA1A;TNFSF10;RPS3;CASP1;NLRP3;JUN;F2R;TNFRSF10B;FOS;TUBB4B;BAIAP2;TUBA4A;NFKB1;NFKBIA;MYO1D;TUBB2A;NCL;CYCS;ARF6 JAK-STAT signaling pathway 25/162 0 0.0002 0 0 2.993 35.2793 IL22;CDKN1A;CSF2;IL23R;FHL1;IL5RA;PIK3CB;SOCS2;SOCS3;CCND2;IFNL1;MYC;AKT3;PIM1;STAT4;MCL1;CISH;IFNGR1;IFNGR2;OSM;IL2;IL23A;BCL2;IL7R;IL9R Pathways in cancer 56/531 0 0.0003 0 0 1.9518 22.0166 CDKN1A;HSP90AB1;IL23R;IL5RA;PIK3CB;RPS6KA5;CCND2;TFG;MYC;AKT3;PIM1;ELOC;APPL1;SKP1;MAP2K1;HSP90AA1;IFNGR1;TPM3;IFNGR2;F2R;FLT3LG;FOS;AXIN2;PLCB3;IL23A;KIT;RARA;PLCB1;PTGER4;EPAS1;MGST3;PTGER2;GNAI3;CXCR4;PLD1;HSP90B1;CDC42;STAT4;WNT1;CAMK2G;GSTM3;GSTM2;JUN;EGLN3;SMAD3;TGFB1;GADD45B;ZBTB16;NFKB1;IL2;NFKBIA;CDK6;BCL2;CYCS;CALM1;IL7R HIF-1 signaling pathway 19/109 0 0.0003 0 0 3.4531 38.1248 MAP2K1;CDKN1A;EGLN3;PFKFB3;IFNGR1;IFNGR2;RPS6;ENO1;PIK3CB;ENO2;NFKB1;LDHA;MKNK1;AKT3;PGK1;BCL2;ELOC;TIMP1;CAMK2G Legionellosis 13/57 0 0.0004 0 0 4.8193 52.5392 HSPA8;ARF1;CR1;TNF;NFKB1;EEF1A1;EEF1G;NFKBIA;CASP1;CYCS;HSPA1B;TLR2;HSPA1A Cytokine-cytokine receptor interaction 35/295 0.0001 0.0009 0 0 2.2128 21.8481 IL22;CSF2;CSF1;IL23R;CXCR4;IL5RA;TNF;TNFSF13B;IL18RAP;ACVR1C;IFNL1;TNFSF10;CCR6;TNFRSF4;CCR2;IL32;TGFB1;TNFSF14;IFNGR1;CCL20;TNFSF12;IFNGR2;OSM;TNFRSF10B;IL17RE;IL2;CD4;CD40LG;IL23A;TNFRSF25;LTB;IL7R;IL18R1;IL9R;IL17A Hepatitis B 23/162 0.0001 0.0011 0 0 2.7089 26.0446 MAP2K1;EGR2;JUN;CDKN1A;EGR3;SMAD3;TGFB1;DDX3X;PIK3CB;FOS;TNF;YWHAZ;NFKB1;NFKBIA;YWHAQ;MYC;AKT3;CREB3L2;VDAC3;BCL2;STAT4;CYCS;TLR2 Chagas disease 17/102 0.0001 0.0012 0 0 3.2666 30.8437 JUN;TGFB1;IFNGR1;IFNGR2;GNAI3;PIK3CB;FOS;TNF;IL2;NFKB1;NFKBIA;PLCB3;GNA15;PPP2R2B;AKT3;PLCB1;TLR2 TNF signaling pathway 18/112 0.0001 0.0012 0 0 3.1288 29.4865 MAP2K1;JUN;CSF2;CSF1;CCL20;TRADD;TNFAIP3;PIK3CB;FOS;TNF;NFKB1;NFKBIA;SOCS3;RPS6KA5;AKT3;CREB3L2;JUNB;IL18R1 IL-17 signaling pathway 16/94 0.0001 0.0014 0 0 3.3486 30.8928 HSP90AA1;JUN;CSF2;HSP90AB1;JUND;CCL20;TRADD;TNFAIP3;FOS;IL17RE;TNF;NFKB1;HSP90B1;NFKBIA;FOSB;IL17A 1–20 of 292 itemsof 15 pagesDownloading entire data
You must use "Save as" or "Save link as" from the context menu (by right-clicking the button) to download the entire data.
Cluster: c3
Markers
| 0 | 2.2138 | 0.82 | 0.258 | 0 | c3 | CTLA4 |
| 0 | 3.0905 | 0.583 | 0.152 | 0 | c3 | TNFRSF4 |
| 0 | 1.6146 | 0.684 | 0.301 | 0 | c3 | ARID5B |
| 0 | 4.7845 | 0.403 | 0.026 | 0 | c3 | FOXP3 |
| 0 | 2.0413 | 0.662 | 0.292 | 0 | c3 | BATF |
| 0 | 1.7031 | 0.64 | 0.272 | 0 | c3 | MIR4435-2HG |
| 0 | 1.9505 | 0.496 | 0.13 | 0 | c3 | MAF |
| 0 | 2.8664 | 0.423 | 0.067 | 0 | c3 | TBC1D4 |
| 0 | 2.7197 | 0.396 | 0.074 | 0 | c3 | GK |
| 0 | 3.1327 | 0.377 | 0.068 | 0 | c3 | TOX2 |
| 0 | 1.3224 | 0.809 | 0.501 | 0 | c3 | PBXIP1 |
| 0 | 1.9738 | 0.394 | 0.094 | 0 | c3 | IL6R |
| 0 | 3.6244 | 0.292 | 0.035 | 0 | c3 | ICA1 |
| 0 | 2.661 | 0.295 | 0.044 | 0 | c3 | CCR4 |
| 0 | 3.9741 | 0.212 | 0.018 | 0 | c3 | ZC2HC1A |
| 0 | 3.3906 | 0.187 | 0.025 | 0 | c3 | LAIR2 |
| 0 | 3.6278 | 0.147 | 0.013 | 0 | c3 | POU2AF1 |
| 0 | 3.6002 | 0.14 | 0.011 | 0 | c3 | F5 |
| 0 | 3.7228 | 0.131 | 0.01 | 0 | c3 | IL21 |
| 2.771e-300 | 1.3028 | 0.897 | 0.637 | 9.292e-296 | c3 | LTB |
Downloading entire data
You must use "Save as" or "Save link as" from the context menu (by right-clicking the button) to download the entire data.
Enrichment Analysis
- The enrichment analysis results of the top biological pathways associated with the input gene set. Each bar represents a pathway, with the length of the bar indicating the number of input genes overlapping with genes in that pathway. The color intensity of the bars reflects the statistical significance of the enrichment (p-value).Image loading error!
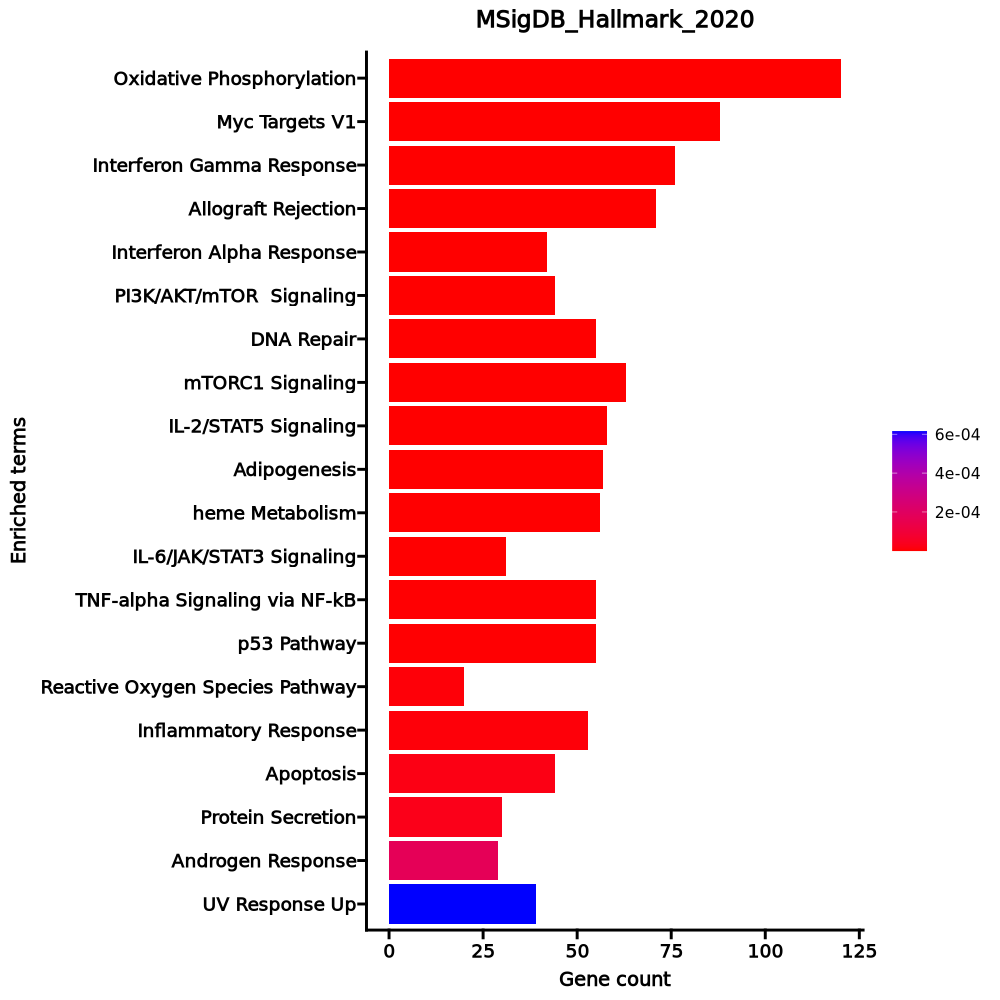
Oxidative Phosphorylation 120/200 1.132e-49 5.661e-48 0 0 9.0431 1019.1833 MTRR;COX6A1;PHB2;TOMM22;ATP6V1E1;ATP6V1G1;ATP6V0E1;ECH1;SDHC;SDHD;SDHA;ATP1B1;SDHB;COX6B1;OXA1L;COX7A2L;POR;UQCRC1;VDAC2;SUCLG1;VDAC1;UQCRC2;ISCU;UQCRB;ABCB7;COX17;ATP5MC2;ATP5MC3;COX7A2;UQCRH;PRDX3;LDHB;LDHA;COX11;CYC1;NDUFV2;ATP6V1D;ATP5MG;ATP5MF;COX10;DECR1;ATP6V1F;ATP5ME;SURF1;GOT2;CS;GLUD1;UQCRQ;OGDH;GPI;COX7B;MRPS15;SLC25A3;ALAS1;MRPS11;COX4I1;MRPS12;ETFA;ETFB;MRPL34;COX7C;TIMM17A;UQCRFS1;COX8A;BCKDHA;ATP6V0B;ATP6AP1;GPX4;NDUFC2;NDUFC1;HADHB;HADHA;BDH2;NDUFS8;NDUFS7;NDUFS6;NDUFS4;NDUFS3;NDUFS2;SLC25A5;ATP6V0C;SLC25A6;ECHS1;NDUFB6;NDUFB5;NDUFB4;NDUFB3;TIMM13;NDUFB2;NDUFB1;UQCR11;UQCR10;PDHB;COX5B;COX5A;HSD17B10;ATP5F1A;ATP5F1B;POLR2F;NDUFA9;TIMM8B;ATP5PF;NDUFA8;NDUFA7;ATP5PD;NDUFA6;MDH1;NDUFA5;ATP5PB;MDH2;NDUFA4;NDUFA3;NDUFA2;NDUFA1;ATP5F1C;COX6C;ATP5F1D;ATP5F1E;NDUFAB1;BAX Myc Targets V1 88/200 1.253e-23 3.134e-22 0 0 4.6748 246.5213 YWHAE;HDDC2;SLC25A3;HNRNPU;HNRNPR;PHB2;RPL6;UBE2L3;PSMD8;PSMD7;SNRPD2;YWHAQ;SNRPD1;C1QBP;RACK1;DHX15;PSMD1;MRPL9;TXNL4A;KPNA2;CCT3;SMARCC1;STARD7;PABPC4;RPL22;UBE2E1;ILF2;RAD23B;TUFM;PSMA6;PSMA4;PSMA1;PSMA2;CLNS1A;SNRPG;SRSF3;VDAC1;ERH;HPRT1;PPIA;KPNB1;SET;ODC1;COX5A;GSPT1;PSMA7;HSPD1;PPM1G;PRDX3;LDHA;PSMB2;PSMB3;PCBP1;G3BP1;EIF4H;SNRPB2;CYC1;HNRNPA1;EIF4E;CCT4;RANBP1;XRCC6;NPM1;SF3A1;HNRNPA3;CBX3;PTGES3;CNBP;GOT2;NAP1L1;EIF2S2;SRPK1;RSL1D1;LSM7;COPS5;PSMC4;SERBP1;NDUFAB1;EIF3J;UBA2;RNPS1;PRPF31;HDGF;HNRNPC;SSBP1;EIF3D;EIF4G2;RAN Interferon Gamma Response 76/200 3.337e-16 0 0 0 3.6288 129.3161 RTP4;SAMD9L;BTG1;SPPL2A;UBE2L6;ADAR;IFI35;IFIH1;MT2A;NAMPT;CASP4;EPSTI1;CASP1;PDE4B;CD38;TRIM21;B2M;IFNAR2;SP110;NCOA3;HLA-B;TAP1;ARID5B;HLA-A;VAMP8;PSMA3;MTHFD2;PSMA2;OAS2;IRF4;IRF1;PSME1;PELI1;IRF7;TRIM14;PSME2;LCP2;IRF5;LAP3;RBCK1;VAMP5;LY6E;MVP;FGL2;CSF2RB;SAMHD1;HIF1A;PSMB10;SOCS3;RNF213;PSMB2;ST8SIA4;ISOC1;GBP4;CD74;GCH1;STAT1;STAT2;IL10RA;STAT3;MX1;IFI44;ISG15;SOD2;PSMB8;NFKB1;PSMB9;BST2;ISG20;SELP;ZNFX1;IL7;IL2RB;FAS;PTPN2;PFKP Allograft Rejection 71/200 0 0 0 0 3.252 95.6352 ITK;CSF1;CD80;NCF4;ITGB2;LY75;CD3E;CXCL13;ITGAL;CD3D;ETS1;CTSS;IL27RA;IKBKB;MRPL3;SIT1;B2M;NCK1;IL10;MAP4K1;IFNAR2;SRGN;PRKCB;IFNGR2;IL13;TAP1;IL16;TRAF2;HLA-A;HLA-E;LCK;IRF4;IRF7;HCLS1;LCP2;CD47;LTB;WAS;BCL10;IL2RG;HIF1A;HDAC9;PSMB10;CD79A;ST8SIA4;CSK;IL12RB1;GBP2;CD74;NPM1;FYB1;STAT1;CDKN2A;LIF;IL4;CD2;CD4;CD40LG;PTPRC;IL7;IL2RA;ABI1;BCL3;EIF3J;IL2RB;CD28;UBE2N;FAS;CD247;EIF3D;EIF3A Interferon Alpha Response 42/97 0 0 0 0 4.4863 113.7602 RTP4;SAMD9L;CSF1;CNP;SAMD9;UBE2L6;ADAR;IFI35;TMEM140;IFIH1;LAMP3;EPSTI1;CASP1;GBP2;TRIM21;B2M;GBP4;CD74;SP110;STAT2;MX1;TAP1;HLA-C;IFI44;ISG15;PSMB8;PSMB9;BST2;ISG20;PSMA3;ELF1;SELL;OAS1;IL7;IRF1;PSME1;IRF7;TRIM14;PSME2;LAP3;CD47;LY6E PI3K/AKT/mTOR Signaling 44/105 0 0 0 0 4.2391 106.5623 GSK3B;ARF1;CDKN1B;RALB;CAB39;YWHAB;UBE2D3;PTEN;SLA;ITPR2;DAPP1;IL2RG;TBK1;RPS6KA1;CFL1;MKNK2;THEM4;RAC1;EIF4E;AP2M1;NCK1;MAP2K3;SMAD2;ACTR3;VAV3;ACTR2;PRKCB;STAT2;TRAF2;PTPN11;PPP1CA;IL4;TIAM1;PIKFYVE;ARPC3;LCK;CSNK2B;UBE2N;PIN1;GRB2;CALR;PFN1;SQSTM1;NFKBIB DNA Repair 55/150 0 0 0 0 3.4086 83.834 ARL6IP1;MPG;POLB;MPC2;PDE4B;REV3L;GPX4;NME3;EDF1;RBX1;DDB2;APRT;NT5C3A;DDB1;DAD1;POLR1D;HCLS1;HPRT1;EIF1B;VPS28;GTF2A2;RALA;TSG101;CANT1;GMPR2;COX17;TAF9;SUPT4H1;XPC;NT5C;DGUOK;POLD4;POLR2E;POLR2F;POLR2G;POLR2H;POLR2I;POLR2J;POLR2K;SF3A3;BCAP31;SURF1;TAF12;POLR3GL;TAF10;ADRM1;RPA2;SUPT5H;GTF2H5;POLE4;NUDT21;RPA3;ERCC2;ITPA;ADA mTORC1 Signaling 63/200 0 0 0 0 2.7082 55.7429 GPI;GSK3B;TFRC;UBE2D3;ITGB2;ARPC5L;SLA;ENO1;TBK1;NAMPT;SLC37A4;CTSC;MAP2K3;ACTR3;ACTR2;ELOVL5;CACYBP;PSMA3;PSMA4;MTHFD2;DDIT4;HPRT1;ALDOA;EEF1E1;SQSTM1;PPIA;GAPDH;IDI1;SHMT2;INSIG1;RPN1;FGL2;DAPP1;GLRX;ADD3;CORO1A;HSPD1;LDHA;PSMB5;PRDX1;SSR1;LTA4H;LDLR;ATP6V1D;SEC11A;HSPA4;NFYC;GSR;RPA1;ASNS;PDAP1;EIF2S2;CCT6A;SLC6A6;PFKL;COPS5;PSMC4;PSMC2;CCNG1;TCEA1;CALR;LGMN;NFKBIB IL-2/STAT5 Signaling 58/199 0 0 0 0 2.4178 38.6755 PHTF2;CD83;CSF1;RORA;AHR;IKZF2;IKZF4;CTLA4;TNFRSF8;CCR4;TNFRSF4;PHLDA1;IL10;GPX4;GSTO1;IL1R2;NCOA3;TNFRSF18;IL13;RHOH;TRAF1;TNFRSF1B;ADAM19;TIAM1;IRF4;PLIN2;LTB;SMPDL3A;CD44;PLEC;AHCY;ODC1;FGL2;FURIN;NDRG1;CD79B;SYNGR2;PLAGL1;LRRC8C;LRIG1;SNX9;ICOS;DCPS;GBP4;RABGAP1L;IL10RA;TNFRSF9;LIF;BATF;SELP;SELL;SYT11;IL2RA;IL2RB;BCL2;GALM;IL18R1;BCL2L1 Adipogenesis 57/200 0 0 0 0 2.3418 34.9427 COX7B;MTCH2;GHITM;ETFB;COX6A1;SCP2;PIM3;HIBCH;COX8A;BCKDHA;JAGN1;GPX4;ECH1;TALDO1;ATP1B3;SDHC;SDHB;POR;CAT;UQCRC1;NDUFS3;SUCLG1;PPARG;PLIN2;ALDOA;TKT;ECHS1;UQCR11;UQCR10;TANK;TOB1;PRDX3;BCL2L13;SAMM50;DDT;UCP2;UBC;G3BP2;CYC1;MAP4K3;DECR1;STAT5A;NDUFA5;GADD45A;RIOK3;MDH2;EPHX2;SQOR;DNAJC15;SOD1;CS;PFKL;BCL6;UQCRQ;CCNG2;NDUFAB1;NABP1 heme Metabolism 56/200 0 0 0 0 2.2838 32.1115 TFRC;GDE1;CPOX;NR3C1;BACH1;AQP3;CCDC28A;ALAD;PSMD9;RNF19A;BSG;LAMP2;ACP5;PGLS;CTSB;HTATIP2;MAP2K3;BNIP3L;SLC11A2;NCOA4;ANK1;TENT5C;KAT2B;MINPP1;DAAM1;CAT;TOP1;OPTN;BLVRA;KDM7A;USP15;GYPC;EPB41;AGPAT4;PRDX2;SEC14L1;UCP2;TSPAN5;DCAF11;ATP6V0A1;RBM38;RIOK3;EIF2AK1;UROS;NEK7;ASNS;KLF3;SLC25A38;MFHAS1;SYNJ1;MKRN1;TCEA1;TMCC2;HDGF;LRP10;TMEM9B IL-6/JAK/STAT3 Signaling 31/87 0 0 0 0 3.2397 44.8232 CSF1;EBI3;CSF2RB;CXCL13;IL2RG;PIK3R5;SOCS3;CD38;BAK1;IL12RB1;ITGA4;IL1R1;STAT1;IL10RB;IFNGR2;IL1R2;STAT2;STAT3;PTPN11;TNFRSF1B;IL7;IRF1;IL2RA;FAS;GRB2;LTB;IL6ST;CD44;PTPN2;IL18R1;CRLF2 TNF-alpha Signaling via NF-kB 55/200 0 0 0 0 2.2266 29.445 BTG3;TNFAIP8;BTG1;CD83;B4GALT1;CSF1;CD80;SAT1;IFIH1;ZC3H12A;NAMPT;PDE4B;PHLDA1;DUSP4;MAP2K3;DUSP2;IFNGR2;TAP1;TRAF1;SERPINB8;IRF1;NINJ1;TRIB1;IL6ST;SQSTM1;CD44;BIRC3;NFAT5;SDC4;TANK;RELB;SOCS3;HES1;LDLR;STAT5A;SMAD3;GCH1;GADD45A;CCL20;TNFRSF9;LIF;CFLAR;ATP2B1;SOD2;NFKB1;KLF2;EIF1;NFKB2;SPSB1;BCL6;TNIP1;TNIP2;GPR183;BCL3;NFKBIE p53 Pathway 55/200 0 0 0 0 2.2266 29.445 BTG1;CD82;DGKA;ABAT;SAT1;HINT1;GM2A;FAM162A;RACK1;CASP1;VWA5A;TAP1;AEN;DDB2;VAMP8;WRAP73;RAP2B;MAPKAPK3;TRAF4;DDIT4;NINJ1;S100A4;ISCU;CEBPA;HDAC3;PVT1;PDGFA;RPS27L;NOL8;XPC;RCHY1;NDRG1;TOB1;ZFP36L1;LDHB;ZMAT3;MKNK2;BAK1;RALGDS;IP6K2;PLK3;PMM1;GADD45A;CDKN2A;VDR;LIF;WWP1;BLCAP;PTPN14;CCNG1;FAS;BAX;COQ8A;ADA;MXD4 Reactive Oxygen Species Pathway 20/49 0 0 0 0 4.0273 47.3873 ABCC1;NDUFA6;GPX4;NDUFB4;GSR;GLRX;LSP1;TXN;IPCEF1;SOD2;ATOX1;SOD1;PRDX2;SBNO2;PRDX1;CAT;ERCC2;NDUFS2;PFKP;LAMTOR5 Inflammatory Response 53/200 0 0 0 0 2.1148 24.5818 RTP4;CSF1;CD82;AHR;ADGRE1;RGS1;LAMP3;NAMPT;C3AR1;PDE4B;PROK2;ITGB8;CCR7;IL10;PTGIR;IL1R1;IFNGR2;SLC11A2;RHOG;TNFRSF1B;LCK;IRF1;IRF7;LTA;LCP2;CHST2;LY6E;EBI3;CXCR6;PSEN1;ATP2C1;HIF1A;RASGRP1;PIK3R5;GNA15;LDLR;SLAMF1;GCH1;SLC31A2;CCL20;CD70;IL10RA;TNFRSF9;ADRM1;LIF;ATP2B1;NFKB1;BST2;SELL;GPR183;ABI1;IL2RB;IL18R1 Apoptosis 44/161 0 0.0001 0 0 2.2029 23.62 BTG3;CDKN1B;ROCK1;LEF1;HSPB1;PLAT;BCL10;PSEN1;SAT1;GNA15;BCL2L11;ANKH;CASP4;PEA15;CASP1;PMAIP1;TSPO;CD38;SPTAN1;BCAP31;BNIP3L;GPX4;GCH1;GADD45A;CAV1;GSR;TAP1;CFLAR;SOD2;CDC25B;SOD1;ISG20;CD2;CYLD;IRF1;VDAC2;BAX;FAS;SQSTM1;PLCB2;CD44;DAP3;BCL2L1;BIRC3 Protein Secretion 30/96 0 0.0001 0 0 2.6577 27.7744 NAPA;STX12;ARF1;TSG101;SGMS1;SNAP23;ICA1;CLTA;CLN5;LMAN1;SNX2;LAMP2;AP2S1;AP2M1;CTSC;RAB2A;ARFGEF1;ADAM10;STAM;SCAMP3;SOD1;RER1;RAB14;TMX1;ANP32E;RAB9A;ERGIC3;PAM;RAB5A;COPE Androgen Response 29/100 0.0002 0.0005 0 0 2.3867 20.6775 SRP19;IDI1;TNFAIP8;B4GALT1;INSIG1;STK39;DBI;IQGAP2;SAT1;NDRG1;LMAN1;ANKH;MAP7;B2M;RAB4A;XRCC6;UBE2I;XRCC5;TMEM50A;ELOVL5;ACTN1;NCOA4;GSR;ADRM1;ARID5B;MAF;VAPA;SMS;FKBP5 UV Response Up 39/158 0.0006 0.0015 0 0 1.9162 14.1682 BTG3;ALAS1;BTG1;TFRC;CNP;RPN1;CLTB;HNRNPU;FURIN;AQP3;RASGRP1;PPP1R2;DNAJB1;BCL2L11;BSG;AP2S1;MGAT1;BAK1;POLR2H;ATP6V1F;STARD3;KLHDC3;GCH1;PLCL1;TAP1;ASNS;PDAP1;HLA-F;SOD2;EIF2S3;PSMC3;IRF1;SELENOW;TMBIM6;IL6ST;ALDOA;SQSTM1;NUP58;GRINA 1–20 of 50 itemsof 3 pagesDownloading entire data
You must use "Save as" or "Save link as" from the context menu (by right-clicking the button) to download the entire data.
- The enrichment analysis results of the top biological pathways associated with the input gene set. Each bar represents a pathway, with the length of the bar indicating the number of input genes overlapping with genes in that pathway. The color intensity of the bars reflects the statistical significance of the enrichment (p-value).Image loading error!
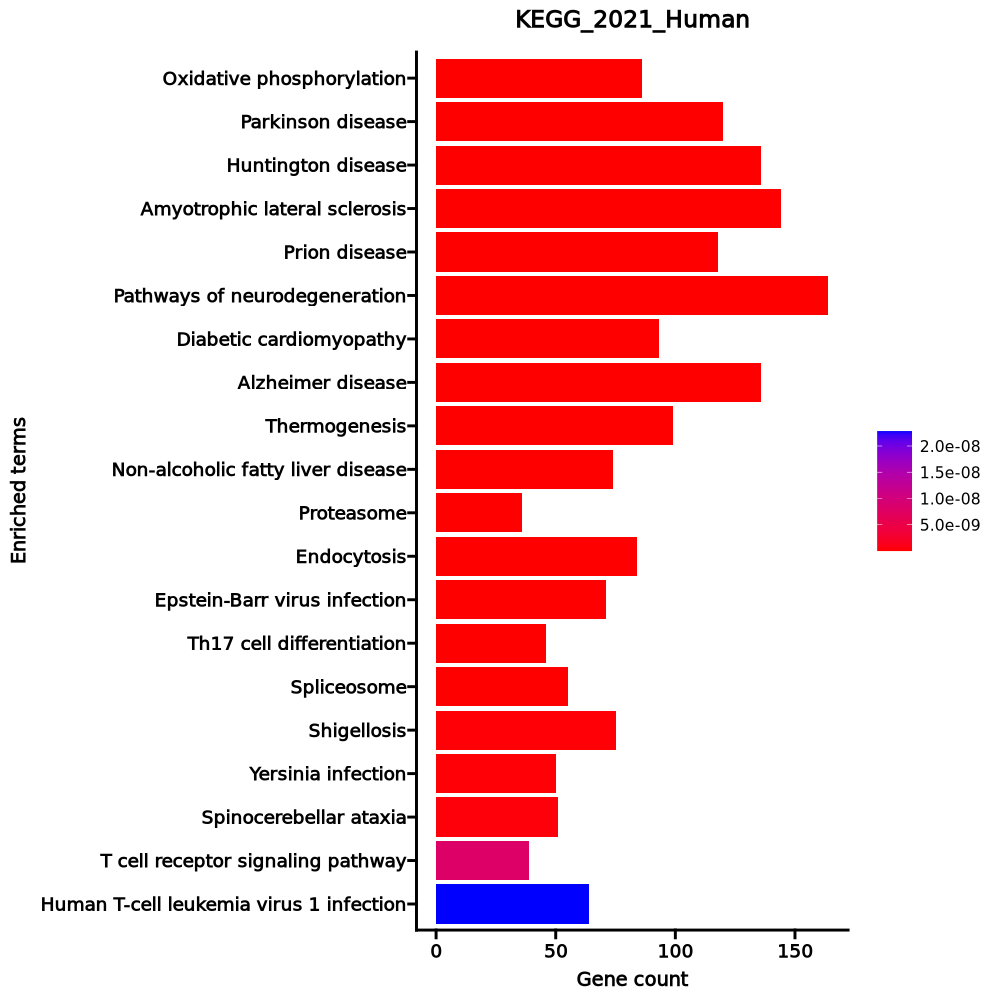
Oxidative phosphorylation 86/133 1.386e-39 4.381e-37 0 0 10.921 977.1436 NDUFA13;COX7B;NDUFA11;NDUFA12;COX4I1;NDUFA10;COX6A1;COX7C;UQCRFS1;ATP6V1E1;COX8A;ATP6V1G1;ATP6V0B;ATP6V0E1;ATP6AP1;NDUFC2;SDHC;NDUFC1;SDHD;SDHA;SDHB;COX6B1;COX7A2L;NDUFS8;NDUFS7;NDUFS6;NDUFS5;NDUFS4;UQCRC1;ATP6V1B2;NDUFS3;NDUFS2;UQCRC2;ATP6V0D1;ATP6V0C;ATP6V1A;NDUFB9;NDUFB10;UQCRB;NDUFB6;NDUFB11;NDUFB5;NDUFB4;COX17;NDUFB3;ATP5MC2;NDUFB2;ATP5MC3;NDUFB1;COX7A2;UQCR11;UQCR10;COX5B;COX5A;UQCRH;ATP5F1A;ATP5F1B;COX11;CYC1;NDUFV2;ATP6V0E2;ATP5MG;ATP6V1D;ATP5MF;COX10;ATP5ME;ATP6V0A1;ATP6V1F;NDUFA9;ATP5PF;NDUFA8;NDUFA7;ATP5PD;NDUFA6;NDUFA5;ATP5PB;NDUFA4;NDUFA3;NDUFA2;NDUFA1;ATP5F1C;COX6C;ATP5F1D;ATP5F1E;UQCRQ;NDUFAB1 Parkinson disease 120/249 1.555e-36 2.077e-34 0 0 5.592 461.0645 NDUFA13;NDUFA11;NDUFA12;NDUFA10;UBE2L6;PARK7;COX6A1;UBE2L3;TXN2;PSMD8;PSMD9;PSMD6;PSMD7;PSMD4;PSMD2;KIF5B;PSMD1;MAP3K5;SDHC;SDHD;SDHA;SDHB;COX6B1;COX7A2L;UQCRC1;VDAC2;VDAC1;UQCRC2;PSMD11;NDUFB10;UQCRB;NDUFB11;ATP5MC2;ATP5MC3;ITPR2;COX7A2;TXN;UBE2J2;UQCRH;UBC;CYC1;NDUFV2;SEM1;UQCRQ;CALM3;UBA1;CALM2;BCL2L1;COX7B;COX4I1;COX7C;UQCRFS1;COX8A;NDUFC2;NDUFC1;PSMA5;PSMA6;PSMA3;PSMA4;NDUFS8;PSMA1;ADORA2A;NDUFS7;PSMA2;NDUFS6;NDUFS5;NDUFS4;NDUFS3;NDUFS2;MAPT;SLC25A5;SLC25A6;NDUFB9;CAMK2D;NDUFB6;NDUFB5;NDUFB4;NDUFB3;NDUFB2;NDUFB1;UQCR11;UQCR10;COX5B;COX5A;PSMA7;GNAI2;PSMB6;PSMB7;ATP5F1A;PSMB4;ATP5F1B;PSMB5;PSMB2;PSMB3;PSMB1;NDUFA9;ATP5PF;NDUFA8;NDUFA7;ATP5PD;NDUFA6;NDUFA5;ATP5PB;NDUFA4;NDUFA3;ADRM1;NDUFA2;NDUFA1;UBE2G1;ATP5F1C;COX6C;ATP5F1D;ATP5F1E;PSMC5;PSMC3;PSMC4;PSMC1;NDUFAB1;PSMC2;BAX Huntington disease 136/306 1.972e-36 2.077e-34 0 0 4.8248 396.6711 NDUFA13;NDUFA11;NDUFA12;NDUFA10;COX6A1;PSMD8;PSMD9;PSMD6;PSMD7;CREB3L3;PSMD4;PSMD2;KIF5B;PSMD1;AP2M1;MAP3K5;SDHC;SDHD;SDHA;ATG13;SDHB;COX6B1;COX7A2L;UQCRC1;VDAC2;VDAC1;UQCRC2;PSMD11;NDUFB10;UQCRB;NDUFB11;ATP5MC2;ATP5MC3;COX7A2;UQCRH;CYC1;NDUFV2;SEM1;UQCRQ;COX7B;COX4I1;CLTB;CLTA;COX7C;BBC3;ACTR1B;RB1CC1;UQCRFS1;IFT57;COX8A;GPX7;NDUFC2;NDUFC1;TRAF2;WIPI2;PSMA5;PSMA6;PSMA3;PSMA4;CREB1;NDUFS8;PSMA1;NDUFS7;PSMA2;NDUFS6;NDUFS5;NDUFS4;NDUFS3;NDUFS2;PPARG;PIK3C3;SLC25A5;PLCB2;SLC25A6;BECN1;DCTN5;NDUFB9;DCTN2;NDUFB6;DNAH8;HDAC1;NDUFB5;NDUFB4;DCTN3;NDUFB3;NDUFB2;NDUFB1;UQCR11;UQCR10;COX5B;COX5A;PSMA7;PSMB6;PSMB7;ATP5F1A;PSMB4;ATP5F1B;PSMB5;PSMB2;PSMB3;PSMB1;AP2S1;POLR2E;POLR2F;POLR2G;POLR2H;POLR2I;POLR2J;POLR2K;NDUFA9;ATP5PF;NDUFA8;NDUFA7;ATP5PD;NDUFA6;NDUFA5;ATP5PB;NDUFA4;NDUFA3;ADRM1;NDUFA2;NDUFA1;ATP5F1C;COX6C;SOD2;ATP5F1D;ATP5F1E;SOD1;PSMC5;REST;PSMC3;PSMC4;PSMC1;NDUFAB1;PSMC2;BAX Amyotrophic lateral sclerosis 144/364 9.858e-32 7.788e-30 0 0 3.9472 281.8075 NDUFA13;NDUFA11;NDUFA12;NDUFA10;COX6A1;ACTB;ACTG1;PSMD8;PSMD9;PSMD6;PSMD7;TBK1;PSMD4;PSMD2;KIF5B;PSMD1;MAP3K5;MAP2K3;GABARAPL2;ANXA11;SDHC;SDHD;SDHA;ATG13;SDHB;COX6B1;COX7A2L;UQCRC1;SRSF3;VDAC1;UQCRC2;PFN1;SQSTM1;OPTN;VCP;SEH1L;PSMD11;NDUFB10;UQCRB;NDUFB11;ATP5MC2;ATP5MC3;COX7A2;GABARAP;UQCRH;TPR;CYC1;NDUFV2;SEM1;UQCRQ;CHMP2B;BCL2;RAB5A;BCL2L1;COX7B;COX4I1;COX7C;ACTR1B;RB1CC1;NUP62;CASP1;ANXA7;UQCRFS1;RAC1;COX8A;GPX7;NDUFC2;NDUFC1;TRAF2;WIPI2;TNFRSF1B;PSMA5;PSMA6;PSMA3;PSMA4;NDUFS8;PSMA1;NDUFS7;PSMA2;NDUFS6;NDUFS5;NUP50;CAT;NDUFS4;NDUFS3;NDUFS2;PIK3C3;NUP58;BECN1;DCTN5;NDUFB9;DCTN2;NDUFB6;DNAH8;NDUFB5;NDUFB4;DCTN3;NDUFB3;DERL1;NDUFB2;NDUFB1;UQCR11;UQCR10;COX5B;COX5A;TANK;PSMA7;PSMB6;PSMB7;ATP5F1A;PSMB4;ATP5F1B;PSMB5;PSMB2;PSMB3;PSMB1;HNRNPA1;UBQLN2;NDUFA9;ATP5PF;NDUFA8;HNRNPA3;NDUFA7;ATP5PD;NDUFA6;NDUFA5;ATP5PB;NDUFA4;NDUFA3;ADRM1;NDUFA2;NDUFA1;ATP5F1C;COX6C;ATP5F1D;ATP5F1E;SOD1;PSMC5;PSMC3;PSMC4;PSMC1;NDUFAB1;PSMC2;BAX Prion disease 118/273 2.248e-30 1.421e-28 0 0 4.5661 311.717 ATF2;NDUFA13;NDUFA11;NDUFA12;NCF4;NDUFA10;COX6A1;PSMD8;PSMD9;PSMD6;PSMD7;CREB3L3;PSMD4;PSMD2;KIF5B;PSMD1;SDHC;SDHD;SDHA;SDHB;COX6B1;COX7A2L;CSNK2B;UQCRC1;VDAC2;VDAC1;UQCRC2;PSMD11;NDUFB10;UQCRB;NDUFB11;ATP5MC2;ATP5MC3;ITPR2;COX7A2;UQCRH;CYC1;NDUFV2;HSPA8;CAV1;SEM1;UQCRQ;RYR1;GSK3B;COX7B;COX4I1;PIK3CB;COX7C;RAC2;UQCRFS1;RAC1;COX8A;NDUFC2;NDUFC1;PSMA5;PSMA6;PSMA3;PSMA4;CREB1;NDUFS8;PSMA1;NDUFS7;PSMA2;NDUFS6;NDUFS5;NDUFS4;NDUFS3;NDUFS2;SLC25A5;SLC25A6;NDUFB9;ATF6B;NDUFB6;NDUFB5;NDUFB4;NDUFB3;NDUFB2;NDUFB1;UQCR11;UQCR10;COX5B;COX5A;PSMA7;PSMB6;PSMB7;ATP5F1A;PSMB4;ATP5F1B;PSMB5;PSMB2;PSMB3;PSMB1;MAPK3;NDUFA9;ATP5PF;NDUFA8;NDUFA7;ATP5PD;NDUFA6;NDUFA5;ATP5PB;NDUFA4;NDUFA3;ADRM1;NDUFA2;NDUFA1;ATP5F1C;COX6C;ATP5F1D;ATP5F1E;SOD1;PSMC5;PSMC3;PSMC4;PSMC1;NDUFAB1;PSMC2;BAX Pathways of neurodegeneration 164/475 6.672e-28 3.514e-26 0 0 3.1857 199.3416 NDUFA13;CSF1;NDUFA11;NDUFA12;NDUFA10;UBE2L6;PARK7;COX6A1;UBE2L3;PSMD8;PSMD9;PSMD6;PSMD7;TBK1;FRAT2;PSMD4;PSMD2;KIF5B;PSMD1;CAPN1;MAP3K5;MAP2K3;GABARAPL2;PRKCB;TPTEP2-CSNK1E;SDHC;SDHD;SDHA;ATG13;SDHB;COX6B1;COX7A2L;CSNK2B;UQCRC1;VDAC2;VDAC1;UQCRC2;SQSTM1;OPTN;VCP;PSMD11;UQCRB;NDUFB10;NDUFB11;ATP5MC2;ITPR2;ATP5MC3;COX7A2;PSEN1;UBE2J2;GABARAP;UQCRH;ATXN1;UBC;CYC1;NDUFV2;WNT10A;NFKB1;SEM1;CDK5;UQCRQ;CHMP2B;BCL2;CALM3;UBA1;RAB5A;CALM2;BCL2L1;RYR1;GSK3B;COX7B;COX4I1;COX7C;ACTR1B;RB1CC1;UQCRFS1;RAC1;IFT57;COX8A;GPX7;NDUFC2;NDUFC1;TRAF2;WIPI2;TNFRSF1B;PSMA5;PSMA6;PSMA3;PSMA4;NDUFS8;PSMA1;NDUFS7;PSMA2;NDUFS6;NDUFS5;CAT;NDUFS4;NDUFS3;NDUFS2;PIK3C3;MAPT;SLC25A5;PLCB2;SLC25A6;BECN1;NDUFB9;DCTN5;CAMK2D;NDUFB6;DCTN2;NDUFB5;DNAH8;NDUFB4;NDUFB3;DCTN3;NDUFB2;DERL1;NDUFB1;UQCR11;UQCR10;COX5B;TANK;HSD17B10;COX5A;PSMA7;PSMB6;PSMB7;PSMB4;ATP5F1A;PSMB5;ATP5F1B;PSMB2;PSMB3;PSMB1;BAK1;MAPK3;NDUFA9;NDUFA8;ATP5PF;NDUFA7;NDUFA6;ATP5PD;NDUFA5;CSNK1A1;NDUFA4;ATP5PB;NDUFA3;ADRM1;NDUFA2;NDUFA1;UBE2G1;ATP5F1C;COX6C;ATP5F1D;ATP5F1E;SOD1;PSMC5;PSMC3;PSMC4;PSMC1;PSMC2;NDUFAB1;FAS;BAX Diabetic cardiomyopathy 93/203 1.694e-26 7.648e-25 0 0 5.0397 299.0575 GSK3B;COX7B;NDUFA13;NDUFA11;NDUFA12;COX4I1;NCF4;NDUFA10;PTEN;PIK3CB;COX6A1;COX7C;PPP1CC;AKT2;MPC2;RAC2;UQCRFS1;RAC1;PDK2;COX8A;PARP1;PRKCB;NDUFC2;SDHC;NDUFC1;SDHD;SDHA;SDHB;COX6B1;COX7A2L;NDUFS8;NDUFS7;TBC1D4;NDUFS6;NDUFS5;NDUFS4;UQCRC1;NDUFS3;VDAC2;NDUFS2;VDAC1;UQCRC2;SLC25A5;PLCB2;GAPDH;SLC25A6;NDUFB9;CAMK2D;NDUFB10;UQCRB;NDUFB6;NDUFB11;NDUFB5;NDUFB4;NDUFB3;ATP5MC2;NDUFB2;ATP5MC3;NDUFB1;UQCR11;COX7A2;UQCR10;PDHB;COX5B;COX5A;UQCRH;ATP5F1A;ATP5F1B;CYC1;NDUFV2;SMAD2;NDUFA9;ATP5PF;NDUFA8;NDUFA7;ATP5PD;SMAD3;NDUFA6;NDUFA5;ATP5PB;NDUFA4;NDUFA3;GSR;NDUFA2;NDUFA1;ATP5F1C;COX6C;ATP5F1D;ATP5F1E;NFKB1;PPP1CA;UQCRQ;NDUFAB1 Alzheimer disease 136/369 1.957e-26 7.728e-25 0 0 3.5071 207.6092 NDUFA13;CSF1;NDUFA11;NDUFA12;NDUFA10;COX6A1;PSMD8;PSMD9;PSMD6;FRAT2;PSMD7;PSMD4;AKT2;PSMD2;KIF5B;PSMD1;CAPN1;MAP3K5;TPTEP2-CSNK1E;ADAM10;SDHC;SDHD;SDHA;ATG13;SDHB;COX6B1;COX7A2L;ADAM17;CSNK2B;UQCRC1;VDAC2;VDAC1;UQCRC2;PSMD11;NDUFB10;UQCRB;NDUFB11;ATP5MC2;ATP5MC3;ITPR2;COX7A2;PSEN1;UQCRH;APH1A;CYC1;NDUFV2;WNT10A;NFKB1;SEM1;CDK5;UQCRQ;CALM3;CALM2;GSK3B;COX7B;COX4I1;IDE;PIK3CB;COX7C;IKBKB;RB1CC1;UQCRFS1;COX8A;MME;NDUFC2;NDUFC1;TRAF2;WIPI2;PSMA5;PSMA6;PSMA3;PSMA4;NDUFS8;PSMA1;NDUFS7;PSMA2;NDUFS6;NDUFS5;NDUFS4;NDUFS3;NDUFS2;PIK3C3;MAPT;SLC25A5;PLCB2;GAPDH;SLC25A6;BECN1;NDUFB9;NDUFB6;NDUFB5;NDUFB4;NDUFB3;NDUFB2;NDUFB1;UQCR11;UQCR10;COX5B;COX5A;HSD17B10;PSMA7;PSMB6;PSMB7;ATP5F1A;PSMB4;ATP5F1B;PSMB5;PSMB2;PSMB3;PSMB1;MAPK3;NDUFA9;ATP5PF;NDUFA8;NDUFA7;ATP5PD;NDUFA6;NDUFA5;ATP5PB;CSNK1A1;NDUFA4;NDUFA3;ADRM1;NDUFA2;NDUFA1;ATP5F1C;COX6C;ATP5F1D;ATP5F1E;PSMC5;PSMC3;PSMC4;PSMC1;NDUFAB1;PSMC2;FAS Thermogenesis 99/232 3.684e-25 1.293e-23 0 0 4.4405 249.8235 ATF2;NDUFA13;SMARCB1;NDUFA11;NDUFA12;NDUFA10;COX6A1;ACTB;ACTG1;CREB3L3;RPS6KA2;RPS6KA1;MAP3K5;MAP2K3;SMARCC1;SMARCC2;ACSL4;SDHC;SDHD;SDHA;SDHB;COX6B1;COX7A2L;UQCRC1;UQCRC2;COX16;NDUFB10;UQCRB;NDUFB11;COX17;ATP5MC2;ATP5MC3;COX7A2;UQCRH;COX11;COX14;CYC1;NDUFV2;ATP5MG;ATP5MF;COX10;ATP5ME;COA3;UQCRQ;NDUFAF3;GRB2;FGFR1;COX7B;COX4I1;COX7C;UQCRFS1;COA6;COA5;COX8A;NDUFC2;SIRT6;NDUFC1;CREB1;NDUFS8;NDUFS7;NDUFS6;NDUFS5;NDUFS4;NDUFS3;NDUFS2;PPARG;NDUFB9;NDUFB6;NDUFB5;NDUFB4;NDUFB3;NDUFB2;NDUFB1;UQCR11;UQCR10;COX5B;COX5A;ATP5F1A;ATP5F1B;NDUFA9;SMARCE1;ATP5PF;NDUFA8;NDUFA7;ATP5PD;NDUFA6;NDUFA5;ATP5PB;NDUFA4;NDUFA3;NDUFA2;NDUFA1;ATP5F1C;COX6C;ATP5F1D;ATP5F1E;NDUFAB1;RPS6KB2;PNPLA2 Non-alcoholic fatty liver disease 74/155 1.047e-22 3.308e-21 0 0 5.4189 274.2583 GSK3B;NDUFA13;COX7B;NDUFA11;NDUFA12;COX4I1;NDUFA10;PIK3CB;COX6A1;COX7C;IKBKB;AKT2;MLX;UQCRFS1;RAC1;IL6R;MAP3K5;COX8A;NDUFC2;SDHC;NDUFC1;TRAF2;SDHD;SDHA;SDHB;COX6B1;COX7A2L;NDUFS8;NDUFS7;NDUFS6;NDUFS5;NDUFS4;UQCRC1;NDUFS3;NDUFS2;PPARG;UQCRC2;CEBPA;NDUFB9;NDUFB10;UQCRB;NDUFB6;NDUFB11;NDUFB5;NDUFB4;NDUFB3;NDUFB2;NDUFB1;COX7A2;UQCR11;UQCR10;COX5B;COX5A;UQCRH;CDC42;SOCS3;BCL2L11;CYC1;NDUFV2;NDUFA9;NDUFA8;NDUFA7;NDUFA6;NDUFA5;NDUFA4;NDUFA3;NDUFA2;NDUFA1;COX6C;NFKB1;UQCRQ;NDUFAB1;BAX;FAS Proteasome 36/46 7.51e-22 2.157e-20 0 0 21.1619 1029.3314 PSMD11;POMP;PSMA7;PSMB10;PSMB6;PSMD8;PSMB7;PSMD9;PSMB4;PSMD6;PSMB5;PSMD7;PSMB2;PSMD4;PSMB3;PSMD2;PSMB1;PSMD1;PSMF1;ADRM1;PSMB8;PSMB9;PSMA5;SEM1;PSMA6;PSMA3;PSMC5;PSMA4;PSMA1;PSMC3;PSMA2;PSMC4;PSMC1;PSMC2;PSME1;PSME2 Endocytosis 84/252 0 0 0 0 2.9609 89.9756 ARF3;ARF4;ARF1;TFRC;WIPF1;SH3KBP1;WIPF2;ARPC1B;ARPC5L;CLTB;CLTA;CAPZB;KIF5B;CHMP1A;AP2M1;WASHC3;SH3GLB1;ACTR3;ACTR2;IST1;HLA-B;HLA-C;HLA-A;HLA-F;RHOA;HLA-E;ARFGAP2;RABEP1;HGS;RAB35;CHMP4B;CHMP3;CHMP4A;STAMBP;VPS25;CHMP7;VPS28;ARF5;ARF6;RAB7A;CHMP5;RAB5B;RAB5C;TSG101;ASAP1;IL2RG;SNX3;CDC42;ACTR3C;SNX1;RAB11FIP1;SNX2;GRK6;AP2S1;PIP5K1B;LDLR;SNX5;CYTH1;SNX6;SMAD2;ARFGEF1;HSPA8;RAB4A;SMAD3;CAV1;WWP1;ARPC4;SNF8;STAM;RAB11B;RAB10;EHD4;ARPC2;ARPC3;CAPZA1;IL2RA;CAPZA2;CHMP2B;IL2RB;CHMP2A;SMAP2;RAB5A;FGFR2;SPG21 Epstein-Barr virus infection 71/202 0 0 0 0 3.202 92.3619 CDKN1B;TRADD;PIK3CB;RBPJ;CD3E;ITGAL;CD3D;PSMD8;IKBKB;PSMD6;PSMD7;TBK1;PSMD4;AKT2;PSMD2;PSMD1;RAC1;POLK;B2M;IKBKE;JAK3;JAK1;IFNAR2;MAP2K3;ENTPD1;HLA-B;HLA-C;TAP1;TRAF2;HLA-A;HLA-F;HLA-E;DDB2;OAS1;OAS2;TRAF3;IRF7;CD44;PSMD11;HDAC1;RELB;BCL2L11;E2F3;HES1;CD58;BAK1;GADD45A;STAT1;STAT2;STAT3;ADRM1;ISG15;NFKB1;GADD45G;NFKB2;SEM1;PSMC5;SNW1;PSMC3;PSMC4;PSMC1;PSMC2;BCL2;FAS;BAX;TAB2;CALR;CD247;NFKBIE;MAP3K14;NFKBIB Th17 cell differentiation 46/107 0 0 0 0 4.4349 121.0988 IL21;IL22;IL23R;RORC;RORA;AHR;GATA3;CD3E;IL2RG;HIF1A;CD3D;IL27RA;IKBKB;IL21R;IL12RB1;IL6R;JAK3;JAK1;MAPK3;SMAD2;STAT5A;STAT5B;SMAD3;IL1R1;STAT1;IFNGR2;STAT3;NFATC2;NFATC1;FOXP3;NFKB1;RUNX1;IL4;CD4;IRF4;LCK;IL2RA;IL2RB;PRKCQ;IL17F;CD247;IL6ST;NFKBIE;LAT;NFKBIB;IL17A Spliceosome 55/150 0 0 0 0 3.4086 83.834 TCERG1;HNRNPU;PQBP1;SART1;SNRPD2;SNRPD1;MAGOH;DHX15;TXNL4A;BCAS2;RBM17;BUD31;THOC3;PRPF40A;SYF2;SNRPG;SRSF3;SRSF4;SNRPC;SLU7;SRSF8;SNRPB;SRSF9;SF3B4;SF3B5;SF3B2;SF3B6;SNU13;U2AF1L4;ZMAT2;PUF60;U2AF2;PCBP1;SNRPB2;HNRNPA1;SF3B1;SMNDC1;SF3A3;HSPA8;HNRNPA3;SF3A1;PRPF38A;SF3A2;CCDC12;CWC15;LSM3;LSM8;LSM7;SNRNP40;HNRNPK;LSM6;SNW1;PHF5A;PRPF31;HNRNPC Shigellosis 75/246 0 0 0 0 2.5887 58.1867 ITGB1;GSK3B;ARF1;ARPC1B;UBE2D2;TRADD;UBE2D3;ARPC5L;PIK3CB;ACTB;ACTG1;HK1;IKBKB;TBK1;AKT2;CASP4;CASP1;RAC1;CAPN1;SKP1;ACTR3;GABARAPL2;ACTR2;IL1R1;ACTN1;TRAF2;WIPI2;RHOA;RBX1;CTTN;RRAGB;ELMO1;UBE2V2;HCLS1;PRKCQ;VDAC1;PIK3C3;RBCK1;UBE2V1;PFN1;PLCB2;SQSTM1;CD44;ARF6;BECN1;ROCK1;PXN;ITPR2;BCL10;GABARAP;FOXO1;MALT1;U2AF1L4;CDC42;ACTR3C;UBC;TIFA;WASF2;CYTH1;MAPK3;CBX3;ARPC4;NFKB1;DIAPH1;ARPC2;TNIP1;ARPC3;RPS6KB2;BCL2;UBE2N;TAB3;BAX;TAB2;BCL2L1;NFKBIB Yersinia infection 50/137 0 0 0 0 3.3794 75.4179 ITGB1;GSK3B;WIPF1;WIPF2;ARPC1B;ARPC5L;PIK3CB;ACTB;ACTG1;IKBKB;TBK1;AKT2;RPS6KA2;RPS6KA1;CASP1;RAC2;RAC1;MAP2K3;ACTR3;IL10;VAV3;ACTR2;ITGA4;RHOG;TRAF2;TICAM1;RHOA;LCK;ELMO1;LCP2;ARF6;ROCK1;PXN;WAS;CDC42;ACTR3C;PIP5K1B;WASF2;MAPK3;FYB1;NFATC2;ARPC4;NFATC1;NFKB1;CD4;ARPC2;ARPC3;TAB2;PKN1;LAT Spinocerebellar ataxia 51/143 0 0 0 0 3.2598 70.9834 RYR1;KCNC3;RORA;PIK3CB;RBPJ;PSMD8;PSMD9;PSMD6;PSMD7;PSMD4;AKT2;PSMD2;RB1CC1;PSMD1;MAP3K5;PRKCB;TRAF2;WIPI2;ATG13;PSMA5;PSMA6;PSMA3;PSMA4;PSMA1;PSMA2;VDAC2;VDAC1;PIK3C3;SLC25A5;PLCB2;SLC25A6;BECN1;PSMD11;ITPR2;PSMA7;PSMB6;PSMB7;PSMB4;ATXN1;PSMB5;PSMB2;PSMB3;PSMB1;ADRM1;SEM1;PSMC5;PSMC3;PSMC4;PSMC1;PSMC2;ATXN10 T cell receptor signaling pathway 39/104 0 0 0 0 3.5193 65.6093 GSK3B;ITK;BCL10;PIK3CB;CD3E;RASGRP1;CD3D;MALT1;IKBKB;CDC42;AKT2;NCK2;CTLA4;ICOS;PAK3;PAK2;NCK1;MAPK3;IL10;VAV3;NFATC2;NFATC1;NFKB1;RHOA;IL4;CD4;PTPRC;CD40LG;LCK;CD28;PRKCQ;GRB2;LCP2;CD247;PDCD1;NFKBIE;MAP3K14;LAT;NFKBIB Human T-cell leukemia virus 1 infection 64/219 0 0 0 0 2.43 42.7583 ATF2;TRRAP;ITGB2;PTEN;PIK3CB;CD3E;ITGAL;ELK1;CD3D;ETS1;IKBKB;POLB;CREB3L3;PTTG1;AKT2;CDC26;TSPO;B2M;JAK3;JAK1;IL1R1;IL1R2;HLA-B;HLA-C;HLA-A;HLA-F;HLA-E;KAT2B;CREB1;LCK;LTA;VDAC2;VDAC1;SLC25A5;MAD1L1;SLC25A6;ATF6B;IL2RG;ANAPC10;ANAPC11;RELB;E2F3;MAPK3;STAT5A;SMAD2;STAT5B;RANBP1;FDPS;MAP3K1;RANBP3;SMAD3;CDKN2A;NFATC2;NFATC1;NFKB1;NFKB2;CD4;IL2RA;IL2RB;BAX;CALR;MAP3K14;RAN;BCL2L1 1–20 of 316 itemsof 16 pagesDownloading entire data
You must use "Save as" or "Save link as" from the context menu (by right-clicking the button) to download the entire data.
Cluster: c4
Markers
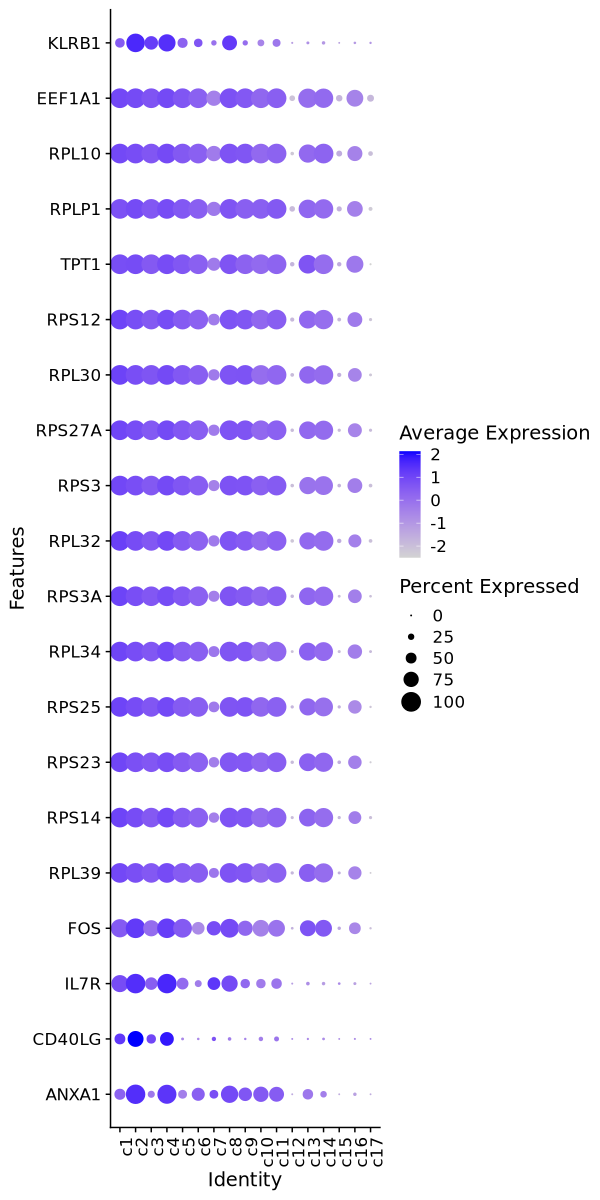
| 0 | 1.139 | 0.962 | 0.568 | 0 | c4 | ANXA1 |
| 0 | 1.4052 | 0.667 | 0.275 | 0 | c4 | CD40LG |
| 0 | 1.5065 | 0.984 | 0.62 | 0 | c4 | IL7R |
| 0 | 1.1772 | 0.992 | 0.821 | 0 | c4 | FOS |
| 0 | 0.5662 | 1 | 0.918 | 0 | c4 | RPL39 |
| 0 | 0.624 | 1 | 0.92 | 0 | c4 | RPS14 |
| 0 | 0.4807 | 1 | 0.921 | 0 | c4 | RPS23 |
| 0 | 0.536 | 1 | 0.922 | 0 | c4 | RPS25 |
| 0 | 0.6029 | 1 | 0.924 | 0 | c4 | RPL34 |
| 0 | 0.5099 | 1 | 0.925 | 0 | c4 | RPS3A |
| 0 | 0.5699 | 1 | 0.926 | 0 | c4 | RPL32 |
| 0 | 0.5495 | 1 | 0.926 | 0 | c4 | RPS3 |
| 0 | 0.5647 | 1 | 0.927 | 0 | c4 | RPS27A |
| 0 | 0.5348 | 1 | 0.928 | 0 | c4 | RPL30 |
| 0 | 0.5351 | 1 | 0.93 | 0 | c4 | RPS12 |
| 0 | 0.5584 | 1 | 0.94 | 0 | c4 | TPT1 |
| 0 | 0.5784 | 1 | 0.948 | 0 | c4 | RPLP1 |
| 0 | 0.5805 | 1 | 0.954 | 0 | c4 | RPL10 |
| 0 | 0.5636 | 1 | 0.956 | 0 | c4 | EEF1A1 |
| 5.169e-306 | 1.0075 | 0.86 | 0.49 | 1.734e-301 | c4 | KLRB1 |
Downloading entire data
You must use "Save as" or "Save link as" from the context menu (by right-clicking the button) to download the entire data.

Enrichment Analysis
- The enrichment analysis results of the top biological pathways associated with the input gene set. Each bar represents a pathway, with the length of the bar indicating the number of input genes overlapping with genes in that pathway. The color intensity of the bars reflects the statistical significance of the enrichment (p-value).Image loading error!
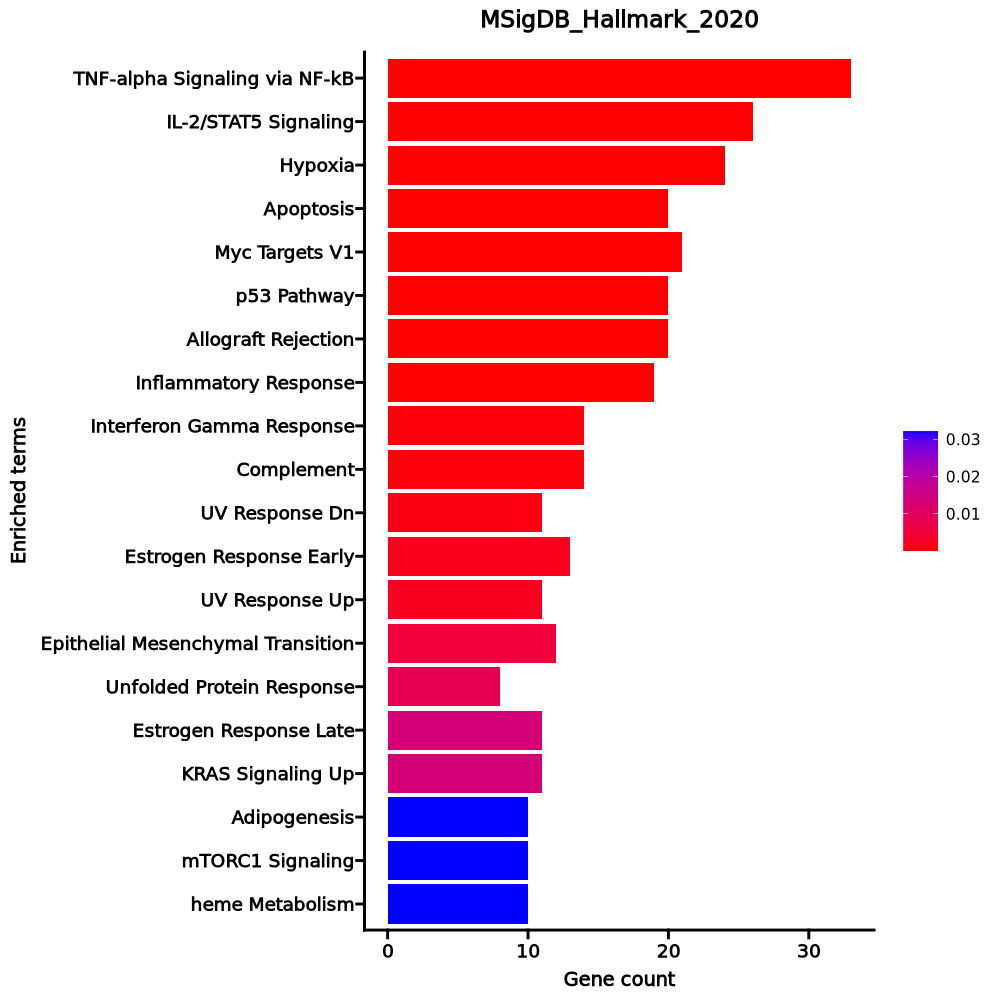
TNF-alpha Signaling via NF-kB 33/200 9.826e-18 4.815e-16 0 0 8.0394 314.8351 PTGER4;PPP1R15A;BTG2;TNFAIP8;CEBPB;BTG1;TNFAIP3;TNF;ZFP36;MYC;PHLDA2;JUNB;IER2;MCL1;ABCA1;EGR1;JUN;EGR3;SMAD3;DUSP1;FOS;PNRC1;EIF1;NFKBIA;NR4A1;KLF6;IL23A;GPR183;BHLHE40;F2RL1;FOSB;CD69;IL7R IL-2/STAT5 Signaling 26/199 0 0 0 0 6.0237 153.8959 AHNAK;PTGER2;CAPG;RORA;NT5E;CCND3;PNP;MYC;SLC39A8;PRNP;XBP1;CISH;GPX4;IFNGR1;FLT3LG;EMP1;DHRS3;ADAM19;ARL4A;KLF6;RRAGD;BHLHE40;BCL2;CD48;LTB;CDC42SE2 Hypoxia 24/200 0 0 0 0 5.4421 119.1673 TPD52;PPP1R15A;JUN;BTG1;ANXA2;CITED2;DUSP1;IGFBP3;TPBG;CXCR4;TNFAIP3;RORA;MIF;FOS;PNRC1;PLAC8;ZFP36;KLF6;RRAGD;BHLHE40;MXI1;BCL2;IDS;S100A4 Apoptosis 20/161 0 0 0 0 5.6246 107.3394 BCAP31;JUN;BTG2;EGR3;ANXA1;GPX4;IFNGR1;SATB1;EMP1;TNF;CLU;CD2;LGALS3;DPYD;LMNA;PDCD4;TXNIP;TIMP1;CD69;MCL1 Myc Targets V1 21/200 0 0 0 0 4.6525 78.8883 RPL34;PABPC4;PTGES3;RPS5;GLO1;CNBP;RPL22;RPLP0;RPS6;RPL6;EEF1B2;RSL1D1;FBL;SNRPD2;MYC;RACK1;RPS3;RPL14;RPS2;RPL18;RPS10 p53 Pathway 20/200 0 0 0 0 4.3971 67.7696 PPP1R15A;JUN;BTG2;BTG1;SLC3A2;FOS;LDHB;HINT1;CCND3;PERP;SESN1;RPL36;RACK1;TXNIP;STOM;S100A4;RPL18;RPS12;S100A10;ZNF365 Allograft Rejection 20/200 0 0 0 0 4.3971 67.7696 TPD52;RPS9;IFNGR1;TRAT1;NCF4;CAPG;RPS3A;RPL9;TNF;IL2;CD2;CCND3;CD4;CD40LG;RPS19;STAT4;TIMP1;LTB;RPL39;CCR2 Inflammatory Response 19/200 0 0 0 0 4.1454 57.7193 ABCA1;PTGER4;IFITM1;BTG2;PTGER2;TPBG;KCNA3;EMP3;SLC4A4;NFKBIA;KLF6;MYC;GPR183;CD48;TIMP1;CD69;ITGA5;IL7R;SLAMF1 Interferon Gamma Response 14/200 0.0006 0.003 0 0 2.9416 21.7304 LGALS3BP;IFITM2;BTG1;CFH;LYSMD2;IFI44;TNFAIP3;IFI44L;NFKBIA;ARL4A;PNP;STAT4;TXNIP;CD69 Complement 14/200 0.0006 0.003 0 0 2.9416 21.7304 CEBPB;CR1;CFH;CPQ;TNFAIP3;GATA3;CLU;DPP4;LGALS3;CD40LG;TIMP1;CALM1;CD46;CTSB UV Response Dn 11/144 0.0011 0.0051 0 0 3.2216 21.8175 INPP4B;SMAD3;ANXA2;CITED2;DUSP1;MYC;AKT3;BHLHE40;PTPRM;NR1D2;FBLN5 Estrogen Response Early 13/200 0.0019 0.0076 0 0 2.7112 17.0322 XBP1;EGR3;CISH;DYNLT3;TPBG;FOS;AQP3;DHRS3;FAM102A;MYC;BHLHE40;BCL2;MYBL1 UV Response Up 11/158 0.0024 0.0091 0 0 2.9126 17.568 NFKBIA;NR4A1;DNAJB1;CCND3;BTG2;BTG1;AMD1;FOSB;FOS;AQP3;JUNB Epithelial Mesenchymal Transition 12/200 0.0052 0.0183 0 0 2.4842 13.0481 JUN;GLIPR1;NT5E;IGFBP3;PLOD3;TNFAIP3;CAPG;TIMP1;EMP3;ITGA5;VIM;FBLN5 Unfolded Protein Response 8/113 0.0082 0.0268 0 0 2.9542 14.1883 EIF4A2;ERN1;RPS14;XBP1;CEBPB;SERP1;DNAJB9;EEF2 Estrogen Response Late 11/200 0.0135 0.039 0 0 2.2605 9.7257 XBP1;ZFP36;EGR3;FAM102A;CISH;PERP;DYNLT3;TPBG;BCL2;PDCD4;FOS KRAS Signaling Up 11/200 0.0135 0.039 0 0 2.2605 9.7257 PPP1R15A;SPON1;CFH;SATB1;IGFBP3;EMP1;CXCR4;F2RL1;TNFAIP3;IL7R;MPZL2 Adipogenesis 10/200 0.0322 0.0788 0 0 2.0399 7.0114 ABCA1;DHRS7;ARL4A;GPX4;IFNGR1;MGST3;CMPK1;PDCD4;STOM;DNAJB9 mTORC1 Signaling 10/200 0.0322 0.0788 0 0 2.0399 7.0114 PPP1R15A;XBP1;BTG2;UFM1;PNP;SERP1;PPA1;BHLHE40;M6PR;CXCR4 heme Metabolism 10/200 0.0322 0.0788 0 0 2.0399 7.0114 MPP1;CAST;BTG2;CCND3;MGST3;MXI1;ACSL6;AQP3;CTSB;SNCA 1–20 of 49 itemsof 3 pagesDownloading entire data
You must use "Save as" or "Save link as" from the context menu (by right-clicking the button) to download the entire data.
- The enrichment analysis results of the top biological pathways associated with the input gene set. Each bar represents a pathway, with the length of the bar indicating the number of input genes overlapping with genes in that pathway. The color intensity of the bars reflects the statistical significance of the enrichment (p-value).Image loading error!
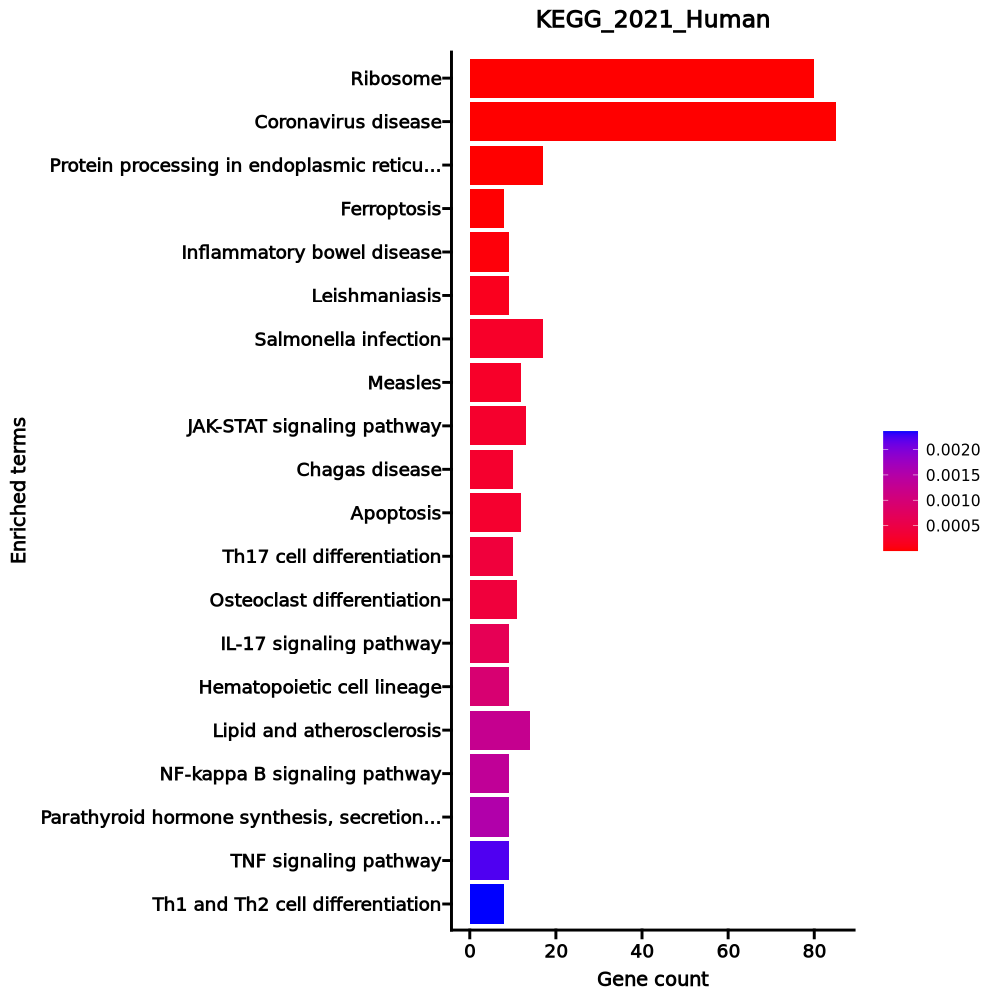
Ribosome 80/158 1.676e-85 4.357e-83 0 0 46.5229 9081.4313 RPL4;RPL5;RPL30;RPL3;RPL32;RPL31;RPL34;RPLP1;RPLP0;RPL10A;RPL8;RPL9;RPL6;RPL7;RPS15;RPS4X;RPS14;RPL7A;RPS16;RPL18A;RPS19;RPL36AL;RPS18;RPL36;RPL35;RPLP2;RPL38;RPL37;RPL39;RPS10;RPS13;RPS12;RPS9;RPL21;RPS7;RPS8;RPL23;RPS5;RPL22;RPS6;RPL13A;RPSA;RPS3A;RPL37A;RPL24;RPL27;RPL26;RPL29;RPL28;UBA52;RPL10;RPL12;RPL11;RPL36A;RPS4Y1;RPS15A;RPL14;RPS3;RPL13;RPL15;RPS2;RPL18;RPS27A;RPL17;RPL19;RPL41;RPL35A;RPL23A;RPS26;RPS25;RPS28;RPS27;RPS29;RPL27A;RPS20;RPL22L1;FAU;RPS21;RPS24;RPS23 Coronavirus disease 85/232 6.575e-76 8.548e-74 0 0 26.4442 4577.8342 RPL4;RPL5;RPL30;RPL3;RPL32;RPL31;RPL34;RPLP1;RPLP0;RPL8;RPL10A;RPL9;TNF;RPL6;RPL7;RPS15;RPS4X;RPS14;RPL7A;RPS16;RPL18A;RPS19;RPL36AL;RPS18;RPL36;RPL35;RPLP2;RPL38;RPL37;RPL39;RPS10;RPS13;RPS12;RPS9;RPL21;RPS7;RPS8;RPL23;RPS5;RPL22;RPS6;RPL13A;RPSA;RPS3A;FOS;RPL37A;RPL24;RPL27;RPL26;RPL29;RPL28;UBA52;RPL10;RPL12;RPL11;RPL36A;RPS4Y1;RPS15A;RPL14;RPS3;RPL13;RPL15;RPS2;RPL18;RPS27A;RPL17;RPL19;JUN;RPL41;RPL35A;RPL23A;IL2;RPS26;NFKBIA;RPS25;RPS28;RPS27;RPS29;RPL27A;RPS20;RPL22L1;FAU;RPS21;RPS24;RPS23 Protein processing in endoplasmic reticulum 17/171 0 0.0002 0 0 4.3477 57.5184 PPP1R15A;BCAP31;XBP1;TRAM1;SSR4;SSR2;SVIP;ERN1;DNAJB1;DAD1;SEC61G;ERP29;BCL2;SEC61B;P4HB;SEC62;SKP1 Ferroptosis 8/41 0 0.0005 0 0 9.4347 111.3466 PRNP;GPX4;FTH1;PCBP2;SLC40A1;ACSL6;SLC3A2;SLC39A8 Inflammatory bowel disease 9/65 0 0.0019 0 0 6.2598 63.874 JUN;SMAD3;IFNGR1;IL23A;STAT4;RORA;GATA3;TNF;IL2 Leishmaniasis 9/77 0.0001 0.0062 0 0 5.152 45.616 EEF1A1;NFKBIA;JUN;CR1;NCF1;IFNGR1;NCF4;FOS;TNF Salmonella infection 17/249 0.0002 0.0066 0 0 2.8743 24.121 JUN;ANXA2;AHNAK;TRADD;DYNLT3;M6PR;FOS;TNF;MYL12A;NFKBIA;TUBA1A;MYC;AKT3;RPS3;BCL2;SKP1;S100A10 Measles 12/139 0.0002 0.0066 0 0 3.689 30.9413 NFKBIA;CCND3;JUN;TRADD;AKT3;BCL2;RACK1;TNFAIP3;FOS;CD46;IL2;SLAMF1 JAK-STAT signaling pathway 13/162 0.0003 0.0066 0 0 3.4094 28.1273 CISH;IFNGR1;FHL1;IL5RA;IL2;CCND3;IL23A;MYC;AKT3;BCL2;STAT4;IL7R;MCL1 Chagas disease 10/102 0.0003 0.0066 0 0 4.2343 34.7992 GNAO1;NFKBIA;JUN;IFNGR1;PPP2R2B;AKT3;FOS;PLCB1;TNF;IL2 Apoptosis 12/142 0.0003 0.0066 0 0 3.6033 29.5074 ERN1;NFKBIA;JUN;TUBA1A;TRADD;AKT3;LMNA;BCL2;FOS;TNF;MCL1;CTSB Th17 cell differentiation 10/107 0.0004 0.008 0 0 4.015 31.4392 NFKBIA;JUN;CD4;SMAD3;IL23A;IFNGR1;RORA;GATA3;FOS;IL2 Osteoclast differentiation 11/127 0.0004 0.008 0 0 3.6969 28.9243 NFKBIA;JUN;JUND;NCF1;IFNGR1;NCF4;AKT3;FOSB;FOS;TNF;JUNB IL-17 signaling pathway 9/94 0.0006 0.012 0 0 4.118 30.2575 NFKBIA;CEBPB;JUN;JUND;TRADD;TNFAIP3;FOSB;FOS;TNF Hematopoietic cell lineage 9/99 0.0009 0.0163 0 0 3.8882 27.1085 CD2;CD4;CR1;CD5;IL5RA;FLT3LG;ITGA5;IL7R;TNF Lipid and atherosclerosis 14/215 0.0012 0.0203 0 0 2.7199 18.1836 ABCA1;JUN;XBP1;NCF1;NCF4;FOS;TNF;ERN1;NFKBIA;CD40LG;AKT3;BCL2;CALM1;PLCB1 NF-kappa B signaling pathway 9/104 0.0013 0.0204 0 0 3.6826 24.3833 NFKBIA;EDARADD;CD40LG;TRADD;BCL2;TNFAIP3;LTB;TNF;TNFSF13B Parathyroid hormone synthesis, secretion and action 9/106 0.0015 0.022 0 0 3.6063 23.3952 EGR1;JUND;NACA;PDE4D;BCL2;GATA3;FOS;PLCB1;RUNX2 TNF signaling pathway 9/112 0.0022 0.0305 0 0 3.3952 20.7298 NFKBIA;JUN;CEBPB;TRADD;AKT3;TNFAIP3;FOS;TNF;JUNB Th1 and Th2 cell differentiation 8/92 0.0024 0.0307 0 0 3.6968 22.359 NFKBIA;JUN;CD4;IFNGR1;STAT4;FOS;GATA3;IL2 1–20 of 260 itemsof 13 pagesDownloading entire data
You must use "Save as" or "Save link as" from the context menu (by right-clicking the button) to download the entire data.
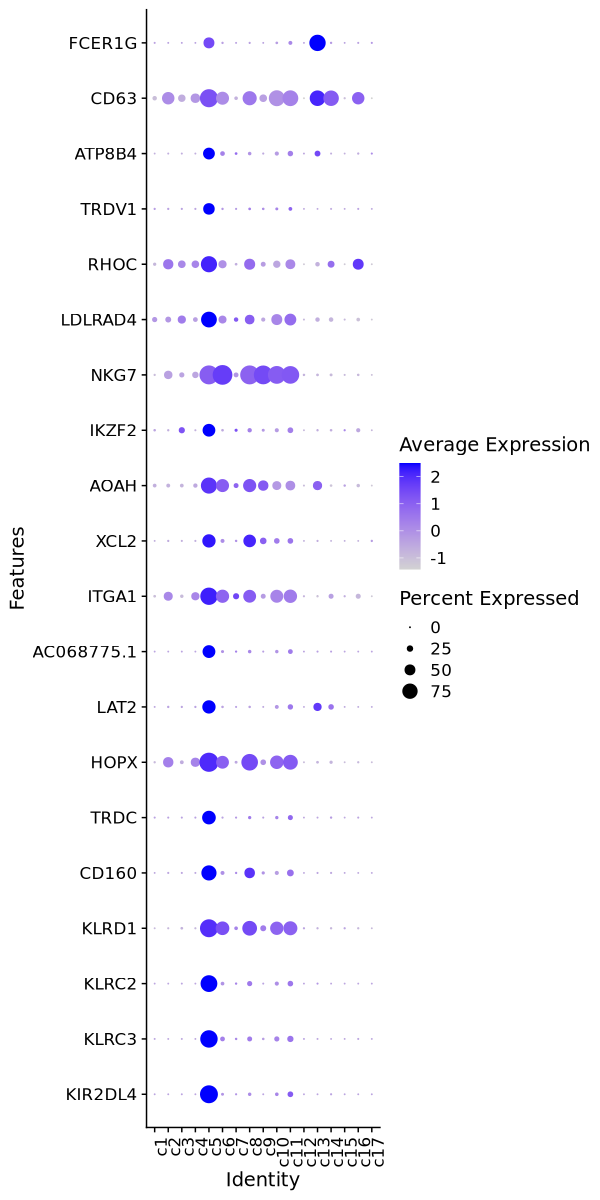
Cluster: c5
Markers
| 0 | 5.6535 | 0.894 | 0.026 | 0 | c5 | KIR2DL4 |
| 0 | 4.7013 | 0.867 | 0.055 | 0 | c5 | KLRC3 |
| 0 | 5.0317 | 0.83 | 0.042 | 0 | c5 | KLRC2 |
| 0 | 2.3006 | 0.896 | 0.218 | 0 | c5 | KLRD1 |
| 0 | 3.609 | 0.74 | 0.08 | 0 | c5 | CD160 |
| 0 | 4.9838 | 0.655 | 0.025 | 0 | c5 | TRDC |
| 0 | 2.3476 | 0.963 | 0.34 | 0 | c5 | HOPX |
| 0 | 4.7975 | 0.637 | 0.032 | 0 | c5 | LAT2 |
| 0 | 4.8589 | 0.609 | 0.027 | 0 | c5 | AC068775.1 |
| 0 | 1.9309 | 0.862 | 0.322 | 0 | c5 | ITGA1 |
| 0 | 2.9891 | 0.637 | 0.103 | 0 | c5 | XCL2 |
| 0 | 1.781 | 0.793 | 0.263 | 0 | c5 | AOAH |
| 0 | 2.5752 | 0.605 | 0.079 | 0 | c5 | IKZF2 |
| 0 | 0.8204 | 0.953 | 0.434 | 0 | c5 | NKG7 |
| 0 | 2.2114 | 0.773 | 0.256 | 0 | c5 | LDLRAD4 |
| 0 | 2.1366 | 0.795 | 0.283 | 0 | c5 | RHOC |
| 0 | 5.129 | 0.535 | 0.026 | 0 | c5 | TRDV1 |
| 0 | 3.5935 | 0.552 | 0.047 | 0 | c5 | ATP8B4 |
| 0 | 1.9299 | 0.904 | 0.417 | 0 | c5 | CD63 |
| 0 | 4.0827 | 0.503 | 0.02 | 0 | c5 | FCER1G |
Downloading entire data
You must use "Save as" or "Save link as" from the context menu (by right-clicking the button) to download the entire data.
Enrichment Analysis
- The enrichment analysis results of the top biological pathways associated with the input gene set. Each bar represents a pathway, with the length of the bar indicating the number of input genes overlapping with genes in that pathway. The color intensity of the bars reflects the statistical significance of the enrichment (p-value).Image loading error!
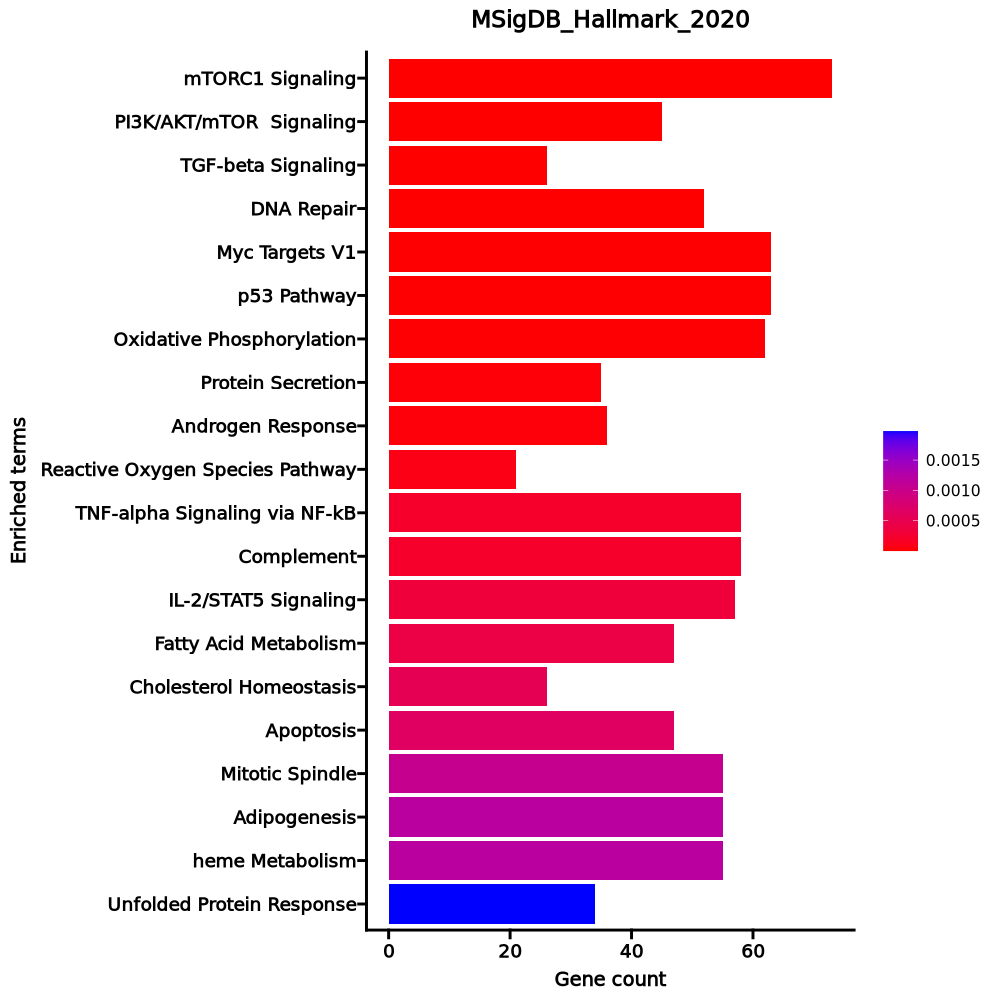
mTORC1 Signaling 73/200 0 0 0 0 2.5545 52.0054 GPI;CDKN1A;PITPNB;UBE2D3;SLC2A1;ENO1;TM7SF2;TBK1;CTSC;PGM1;ACTR3;ACTR2;STARD4;G6PD;TPI1;HMGCS1;IFRD1;ELOVL6;ACSL3;UCHL5;SYTL2;ACLY;PSME3;CANX;TRIB3;ETF1;HPRT1;ALDOA;SQSTM1;GAPDH;SKAP2;IDI1;FKBP2;PSMD14;PSMD13;INSIG1;RPN1;USO1;GMPS;PIK3R3;AK4;SLC1A4;HMGCR;ADIPOR2;UNG;HSP90B1;ATP5MC1;SLC9A3R1;STIP1;EBP;NFIL3;PGK1;SEC11A;HSPA9;CYB5B;SDF2L1;HSPA5;PNO1;HSPA4;IDH1;CYP51A1;RPA1;ASNS;HSPE1;CCT6A;GCLC;UFM1;COPS5;P4HA1;TCEA1;CD9;PSMG1;CALR PI3K/AKT/mTOR Signaling 45/105 0 0 0 0 3.3213 62.1833 CDKN1A;ARF1;RALB;MAPKAP1;UBE2D3;CLTC;PRKAG1;SLC2A1;PIK3R3;FASLG;HSP90B1;RPS6KA3;TBK1;ARHGDIA;PRKAR2A;RPS6KA1;CFL1;AKT1;MAPK1;RIPK1;RAC1;MAP3K7;EIF4E;AP2M1;MAP2K6;NCK1;SMAD2;ACTR3;VAV3;ACTR2;DUSP3;PTPN11;IRAK4;TNFRSF1A;PPP1CA;CDK4;ARPC3;LCK;CAMK4;PIN1;TRIB3;GRB2;CALR;SQSTM1;MYD88 TGF-beta Signaling 26/54 0 0 0 0 4.0989 58.0265 BCAR3;BMPR2;UBE2D3;XIAP;FURIN;THBS1;FNTA;PMEPA1;MAP3K7;TGIF1;KLF10;WWTR1;TGFB1;SMURF2;TGFBR1;RHOA;PPP1CA;FKBP1A;CDK9;PPM1A;APC;ID2;CTNNB1;ID3;ENG;BMPR1A DNA Repair 52/150 0 0 0 0 2.3487 30.9002 MPG;SNAPC5;MRPL40;CLP1;GUK1;MPC2;TMED2;TK2;NELFE;GPX4;RFC2;EDF1;VPS37B;RBX1;DDB1;RRM2B;DAD1;NFX1;HCLS1;HPRT1;EIF1B;VPS28;RALA;RNMT;USP11;DCTN4;TAF9;AK3;XPC;NT5C;SDCBP;DGUOK;POLD4;POLR2C;POLR2D;POLR2E;POLR2G;STX3;POLR2I;RAE1;POLR2K;BCAP31;SURF1;POLR3GL;TAF10;ADRM1;SSRP1;SMAD5;POLR3C;ERCC1;ERCC5;ITPA Myc Targets V1 63/200 0 0.0001 0 0 2.0367 24.2426 HSP90AB1;HNRNPU;PWP1;SYNCRIP;FBL;RUVBL2;AP3S1;ACP1;CCT3;CCT2;STARD7;EIF1AX;IFRD1;MRPS18B;UBE2E1;RAD23B;CANX;TCP1;NHP2;VDAC1;MCM5;ETF1;HPRT1;PABPC1;PRPS2;HDAC2;SET;PSMD14;GLO1;NOLC1;U2AF1;PHB;COX5A;GSPT1;PSMA7;SRM;PCBP1;PGK1;EIF4H;SNRPB2;CYC1;BUB3;CCT7;EIF4E;CCT5;CCT4;XRCC6;SF3A1;SSB;PTGES3;PA2G4;DEK;HSPE1;LSM2;COPS5;CDK4;SERBP1;POLE3;UBA2;RNPS1;EIF3D;EIF4G2;EIF3B p53 Pathway 63/200 0 0.0001 0 0 2.0367 24.2426 CYFIP2;CCNK;CDKN1A;TRIAP1;TM7SF3;PITPNC1;CCND2;FAM162A;KIF13B;CASP1;UPP1;CTSD;TSPYL2;TSC22D1;APAF1;FBXW7;SPHK1;DCXR;ABCC5;DNTTIP2;TRAFD1;AEN;PRKAB1;VAMP8;WRAP73;MAPKAPK3;NINJ1;TXNIP;TRIB3;ATF3;NOTCH1;ABHD4;PVT1;EI24;RGS16;RPS27L;XPC;SLC3A2;FOXO3;PPM1D;ACVR1B;ZFP36L1;SERTAD3;RXRA;SOCS1;DRAM1;ZMAT3;PERP;HMOX1;STOM;EPS8L2;RALGDS;JAG2;CDKN2B;TGFB1;FUCA1;ZBTB16;BAIAP2;BLCAP;MDM2;BAX;ERCC5;RAD9A Oxidative Phosphorylation 62/200 0 0.0001 0 0 1.9892 22.2359 GPI;ISCA1;MRPS12;ETFA;ETFB;TCIRG1;TOMM22;CASP7;MPC1;UQCRFS1;ACADM;ACAA1;PHYH;GPX4;ECH1;SDHD;ATP1B1;SUPV3L1;AFG3L2;COX7A2L;POR;BDH2;NDUFS8;NDUFS7;FDX1;UQCRC1;NDUFS3;VDAC2;VDAC1;DLD;ATP6V0C;SLC25A11;ECHS1;OAT;NDUFB6;MGST3;DLST;MRPS30;PDHB;COX5A;UQCRH;ATP5MC1;TIMM50;CYB5R3;ATP5F1B;ATP6V1H;CYC1;SLC25A20;NDUFV1;ATP6V1F;HSPA9;SURF1;PDHA1;NDUFA6;MDH2;IDH1;NDUFA3;IDH2;ATP5F1C;ATP5F1D;PDP1;BAX Protein Secretion 35/96 0 0.0002 0 0 2.5338 26.7378 NAPA;COPB2;CD63;ARF1;SGMS1;VPS4B;CLTC;SNAP23;USO1;RAB22A;RPS6KA3;TMED2;ATP6V1H;MAPK1;ARFIP1;AP3S1;ATP7A;AP2M1;CTSC;RAB2A;TPD52;BNIP3;COG2;AP2B1;STAM;SCAMP1;IGF2R;ARCN1;GALC;RAB14;TMX1;GNAS;VPS45;RAB5A;VAMP3 Androgen Response 36/100 0 0.0002 0 0 2.4842 26.0703 IDI1;SLC26A2;B4GALT1;HPGD;INSIG1;NGLY1;GNAI3;HSD17B14;UAP1;DBI;HMGCR;MYL12A;UBE2J1;CAMKK2;RPS6KA3;ZMIZ1;AKT1;PMEPA1;PTK2B;ITGAV;PDLIM5;TPD52;ABCC4;RAB4A;XRCC6;UBE2I;HMGCS1;TSC22D1;XRCC5;ADRM1;ACSL3;PA2G4;CDK6;VAPA;GPD1L;PLPP1 Reactive Oxygen Species Pathway 21/49 0.0001 0.0004 0 0 3.3062 31.4744 PRNP;G6PD;ABCC1;NDUFA6;GPX4;LSP1;GLRX2;PRDX6;PDLIM1;PTPA;HHEX;GCLC;SELENOS;FES;CAT;MBP;GCLM;HMOX2;PFKP;FTL;LAMTOR5 TNF-alpha Signaling via NF-kB 58/200 0.0002 0.0008 0 0 1.806 15.3639 CDKN1A;B4GALT1;CSF1;IRS2;LITAF;AREG;SLC2A6;ETS2;ICAM1;IFIT2;ZFP36;CCRL2;SLC16A6;PMEPA1;MAP3K8;DUSP4;KLF10;TGIF1;DUSP5;TSC22D1;RIPK2;SPHK1;GEM;RHOB;NINJ1;SIK1;SQSTM1;ATF3;BIRC2;CEBPB;PFKFB3;BCL2A1;CEBPD;RELA;SNN;DRAM1;NFIL3;CCL5;DNAJB4;CCL4;PDLIM5;STAT5A;GADD45B;TIPARP;TNFRSF9;PNRC1;FOSL2;EHD1;NR4A2;NR4A1;NR4A3;TNIP1;TNIP2;ID2;CLCF1;MAFF;REL;TRIP10 Complement 58/200 0.0002 0.0008 0 0 1.806 15.3639 PRDM4;PREP;CBLB;LIPA;PIK3CG;DOCK10;CASP9;CTSO;CASP7;GNGT2;CSRP1;CASP3;PIM1;CASP1;TIMP1;CTSD;CTSC;DUSP5;USP8;FCER1G;SIRT6;F8;MMP15;LCK;GPD2;FDX1;IRF2;LCP2;LAP3;CD46;LTF;CEBPB;SRC;GNAI3;PRCP;PSEN1;RNF4;GNAI2;VCPIP1;PPP4C;GNG2;CCL5;S100A13;STX4;FYN;SH2B3;LYN;APOBEC3G;HSPA5;GZMA;EHD1;PDP1;RABIF;GNB2;MAFF;GRB2;MSRB1;HSPA1A IL-2/STAT5 Signaling 57/199 0.0003 0.0012 0 0 1.7744 14.259 RNH1;BMPR2;CSF1;GPR65;CTSZ;AHR;ITGAE;IKZF2;CCND2;GLIPR2;CASP3;PIM1;MAP3K8;ITGAV;GABARAPL1;PRKCH;IL4R;CISH;GPX4;SWAP70;TNFRSF18;APLP1;RHOH;RHOB;SERPINB6;IRF4;IRF8;PLPP1;ABCB1;PTGER2;RGS16;CAPG;FURIN;CST7;SYNGR2;SOCS1;NFIL3;PLAGL1;SNX9;PRNP;GADD45B;TNFRSF9;PRAF2;DHRS3;IGF2R;HOPX;MYO1E;P2RX4;MYO1C;P4HA1;SYT11;SNX14;MAFF;IL2RB;BCL2;CDC42SE2;BCL2L1 Fatty Acid Metabolism 47/158 0.0004 0.0015 0 0 1.8702 14.561 IDI1;ECHS1;HPGD;ECI2;DLST;PDHB;ENO2;HSD17B11;HSD17B7;ADIPOR2;CRYZ;LGALS1;HSPH1;AUH;NTHL1;MLYCD;NBN;ACADM;ACAA1;ACSS1;GLUL;CBR1;GABARAPL1;PDHA1;HMGCS1;ACSL1;MDH2;IDH1;UROS;ECH1;ACSL5;SDHD;MIF;PRDX6;ALDH3A2;GRHPR;UGDH;GPD2;ACOT2;SUCLG2;SERINC1;REEP6;PPARA;ALDOA;DLD;MGLL;ALDH9A1 Cholesterol Homeostasis 26/74 0.0005 0.0018 0 0 2.3881 18.0095 ERRFI1;IDI1;HMGCR;HSD17B7;TM7SF2;EBP;NFIL3;STX5;FBXO6;GUSB;FDFT1;FDPS;ABCA2;STARD4;PCYT2;HMGCS1;TNFRSF12A;CHKA;ECH1;CYP51A1;PNRC1;CD9;CTNNB1;ALDOC;TRIB3;ATF3 Apoptosis 47/161 0.0007 0.0021 0 0 1.8207 13.3406 CDKN1A;ROCK1;PRF1;PSEN2;HSPB1;XIAP;NEDD9;FASLG;PSEN1;ENO2;ADD1;RELA;CASP9;PPP3R1;EBP;CASP7;CCND2;BCL2L11;CASP3;PEA15;CASP1;HMOX1;BMF;TIMP1;PDGFRB;BCAP31;DFFA;GSTM1;GADD45B;TNFRSF12A;GPX4;PPP2R5B;IGF2R;RHOB;DNAJC3;MADD;RARA;PDCD4;VDAC2;TXNIP;BAX;CTNNB1;ETF1;SQSTM1;ATF3;BCL2L2;BCL2L1 Mitotic Spindle 55/199 0.001 0.0031 0 0 1.6872 11.5932 TRIO;WASL;SMC4;PREX1;AKAP13;PCM1;KIF5B;ARHGDIA;CEP250;KIFAP3;NCK1;SUN2;RALBP1;ARHGEF12;MAP1S;ARAP3;CSNK1D;ACTN4;RHOF;LATS1;CLIP2;ALS2;BIN1;RASA2;ARHGEF3;MYH9;ARHGEF7;RAPGEF5;SOS1;LLGL1;ARF6;PAFAH1B1;PIF1;ROCK1;NEDD9;CDC42;FGD4;CYTH2;BCL2L11;KATNA1;ABL1;WASF1;PDLIM5;WASF2;CLASP1;DYNC1H1;PCGF5;TBCD;MYO9B;MYO1E;NIN;APC;CENPJ;NF1;RAB3GAP1 Adipogenesis 55/200 0.0012 0.0031 0 0 1.6755 11.3011 SLC25A1;SLC27A1;MTCH2;RNF11;GHITM;ETFB;GPHN;SCP2;ACADM;PGM1;YWHAG;PHYH;GPX4;APLP2;ECH1;ELMOD3;ELOVL6;ACLY;POR;PPM1B;TST;GPD2;RAB34;CAT;UQCRC1;NDUFS3;PREB;ALDOA;DLD;MGLL;ECHS1;CD151;PFKFB3;MGST3;AK2;BAZ2A;ADIPOR2;SAMM50;GPAT4;DDT;UBC;G3BP2;STOM;CYC1;STAT5A;CDKN2C;RIOK3;MDH2;IDH1;VEGFB;RMDN3;CHCHD10;DHRS7;PDCD4;REEP6 heme Metabolism 55/200 0.0012 0.0031 0 0 1.6755 11.3011 ISCA1;NARF;SLC2A1;ICAM4;NR3C1;BACH1;NUDT4;CCDC28A;BSG;ACP5;PGLS;FBXO7;FBXO9;HTATIP2;CAST;ARHGEF12;PPP2R5B;RAD23A;TENT5C;CAT;BLVRB;ATG4A;GYPC;FECH;MGST3;ENDOD1;GMPS;FOXO3;ADIPOR1;ADD1;SDCBP;SEC14L1;TSPAN5;CDR2;MPP1;FN3K;RIOK3;SMOX;EIF2AK1;UROS;SLC10A3;ASNS;FBXO34;EPOR;SLC25A38;GCLC;ARL2BP;P4HA2;TCEA1;YPEL5;GCLM;LRP10;LPIN2;TMEM9B;PICALM Unfolded Protein Response 34/113 0.002 0.0046 0 0 1.898 11.8175 CEBPB;DCTN1;EIF4A3;NOLC1;SLC1A4;SDAD1;HSP90B1;EXOSC10;KIF5B;EIF4EBP1;BANF1;EIF4E;SEC11A;TSPYL2;HSPA9;NOP14;HSPA5;IMP3;NFYB;DDX10;ASNS;WIPI1;PDIA6;YWHAZ;YIF1A;DNAJC3;CNOT2;NHP2;PREB;CALR;ATP6V0D1;ATF6;ATF3;EIF4G1 1–20 of 50 itemsof 3 pagesDownloading entire data
You must use "Save as" or "Save link as" from the context menu (by right-clicking the button) to download the entire data.
- The enrichment analysis results of the top biological pathways associated with the input gene set. Each bar represents a pathway, with the length of the bar indicating the number of input genes overlapping with genes in that pathway. The color intensity of the bars reflects the statistical significance of the enrichment (p-value).Image loading error!
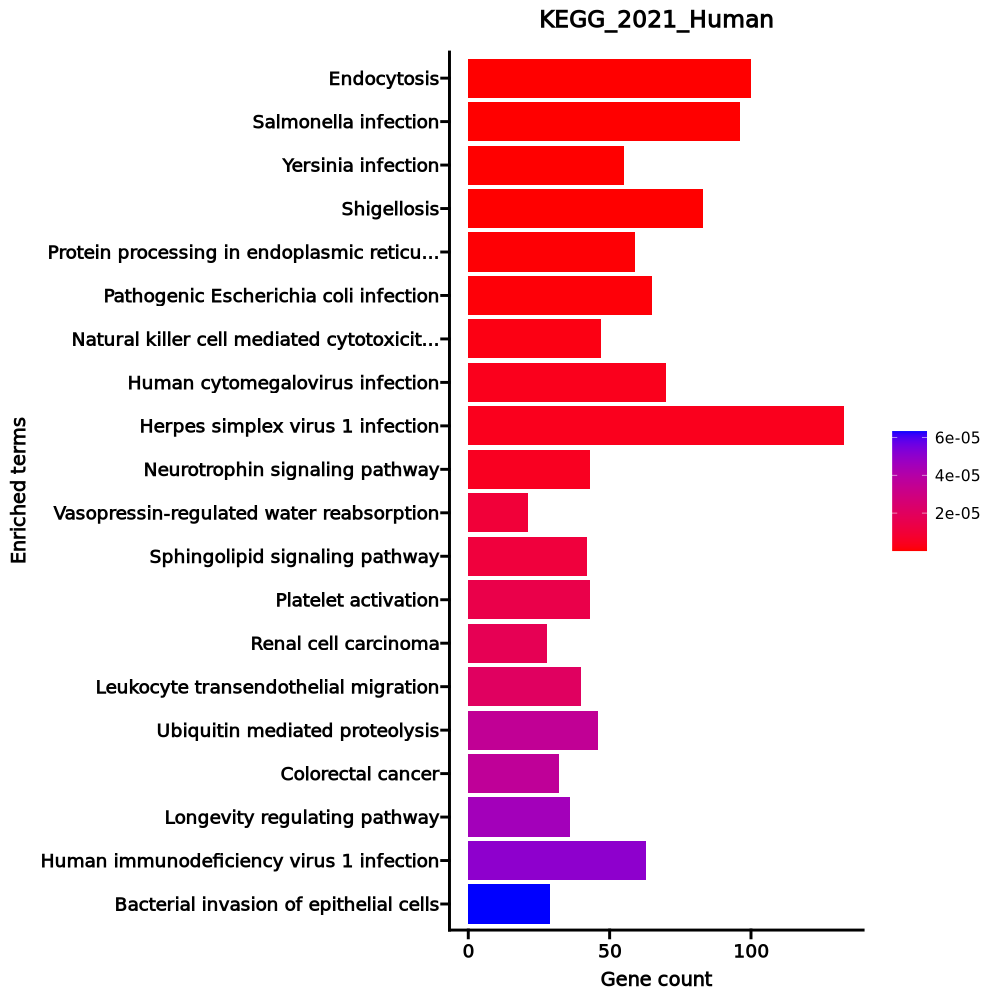
Endocytosis 100/252 0 0 0 0 2.941 98.2813 VPS29;WIPF1;WIPF2;WASHC2C;CBLB;WASHC2A;KIF5B;VPS35;VPS36;AP2M1;SH3GL1;SH3GLB1;USP8;IST1;RNF41;RUFY1;ACAP2;BIN1;HGS;RAB35;CHMP4A;VPS28;RAB5B;RAB5C;AGAP2;VPS26A;VPS26B;ACTR3B;PRKCZ;SNX3;RAB11FIP1;GRK5;GRK4;GRK6;RAB11FIP4;SNX6;SMAD2;RAB4A;SMURF2;VTA1;IQSEC3;HSPA6;SNF8;STAM;ARPC5;IGF2R;EHD1;ARPC2;ARPC3;CHMP2B;MDM2;RAB5A;ARF1;CLTC;AP2A1;ARRB1;WASL;RAB22A;EEA1;PSD4;CHMP1A;CCR5;RAB8A;ACTR3;ACTR2;PDCD6IP;ARAP3;VPS37A;VPS37B;RHOA;DNM1;EPN1;TGFBR1;DNM2;EPN2;TRAF6;CHMP6;ARF5;ARF6;RAB7A;SRC;VPS4B;CBL;CDC42;CYTH3;CYTH2;CYTH4;MVB12B;EPS15;GIT2;AP2B1;RAB11B;ITCH;CAPZA1;CAPZA2;IL2RB;VPS45;HSPA1B;SPG21;HSPA1A Salmonella infection 96/249 0 0 0 0 2.8017 84.1797 CYFIP2;ARF1;HSP90AB1;FHOD1;PIK3CD;WASL;FBXO22;ACTB;PIK3CG;ACTR1A;CASP7;ACTR1B;KIF5B;CASP3;CASP1;AKT1;KPNA4;RAC1;KPNA3;MAP3K7;KPNA1;DYNC2H1;ACTR3;VPS18;MAP2K4;ACTR2;MAP2K2;ANXA2;RIPK2;VPS33A;RHOH;IRAK4;DYNLL1;RHOA;TIRAP;RHOB;DNM2;TNFRSF1A;DYNC1LI1;TRAF6;ELMO2;EXOC5;GAPDH;BIRC2;ARF6;RAB7A;ARL8B;DCTN6;RAB5B;RALA;RAB5C;DCTN2;DCTN1;ROCK2;DCTN4;SNX33;ACTR3B;MYL12A;RELA;MYL12B;STX10;HSP90B1;DYNC2LI1;CDC42;CYTH3;CYTH2;KLC2;CYTH4;RRAS;MYO6;MAPK1;SNX9;RIPK1;FADD;MAP2K7;RILP;VPS16;MAP2K6;DYNC1H1;ARPC5;TUBB4B;TUBB4A;MAPK12;MAPK11;SNX18;ARPC2;ARPC3;VPS41;BCL2;CTNNB1;BAX;PKN1;DYNLRB1;ACTR10;RAB5A;MYD88 Yersinia infection 55/137 0 0 0 0 2.9743 58.3389 ITGB1;WIPF1;WIPF2;PIK3CD;WASL;ACTB;CRKL;RPS6KA3;TBK1;RPS6KA1;CASP1;RAC2;AKT1;RAC1;MAP3K7;ACTR3;VAV3;MAP2K4;ACTR2;MAP2K2;ARHGEF12;IRAK4;RHOA;LCK;TRAF6;ELMO2;LCP2;ARHGEF7;SKAP2;ARF6;ROCK1;ROCK2;SRC;PIK3R3;PIK3R1;ACTR3B;RELA;CDC42;MAPK1;PTK2B;MAP2K7;WASF2;MAP2K6;GIT2;LIMK1;NFATC3;ARPC5;BAIAP2;MAPK12;MAPK11;ARPC2;ARPC3;GNAQ;PKN1;MYD88 Shigellosis 83/246 0 0 0 0 2.2641 42.097 ITGB1;ARF1;CALCOCO2;UBE2D3;ILK;PIK3CD;WASL;ACTB;CRKL;HK1;RPS6KA5;TBK1;CAPNS1;CASP1;AKT1;RAC1;CAPN1;MAP3K7;CAST;ACTR3;ACTR2;GABARAPL1;FNBP1;RIPK2;PRKCE;WIPI1;ACTN4;ATG12;RHOA;RBX1;TNFRSF1A;RRAGA;PLCB3;TRAF6;TRAF5;UBE2V2;HCLS1;ELMO2;VDAC1;RBCK1;TLN1;SQSTM1;PPID;ARF6;BECN1;ROCK1;ROCK2;SRC;PIK3R3;U2AF1;PIK3R1;FOXO3;ACTR3B;MYL12A;RELA;MYL12B;U2AF1L4;CDC42;CYTH3;CYTH2;SHARPIN;CYTH4;UBB;CCL5;UBC;PLCG2;MAPK1;RIPK1;WASF1;WASF2;ATG5;BNIP3;ARPC5;MAPK12;MAPK11;ARPC2;TNIP1;ARPC3;BCL2;MDM2;BAX;MYD88;BCL2L1 Protein processing in endoplasmic reticulum 59/171 0 0 0 0 2.3342 33.9176 HSP90AB1;UBXN2A;PRKCSH;UBE2D3;NGLY1;MAN1A2;UFD1;FBXO6;MAN1A1;CAPN1;UBXN4;SEC63;PDIA3;FBXO2;RAD23A;PDIA6;RAD23B;DDOST;RBX1;DNAJC3;SELENOS;DAD1;DNAJB11;CANX;PLAA;PREB;MAN1B1;ATF6;VCP;SAR1A;RPN1;DERL1;UBE2J2;RNF5;HSP90B1;UBE2J1;DNAJB2;ERLEC1;GANAB;HSPH1;BAG1;MAN1C1;MAP2K7;BCAP31;HSPA5;EIF2AK1;HSPA6;SYVN1;UBE2G1;SVIP;DNAJC10;DNAJA2;BCL2;BAX;STUB1;CALR;SEC24C;HSPA1B;HSPA1A Pathogenic Escherichia coli infection 65/197 0 0 0 0 2.1829 30.5878 CYFIP2;ITGB1;ARF1;WIPF1;WIPF2;FASLG;WASL;ACTB;CASP9;CASP7;CASP3;CASP1;RAC1;MAP3K7;NCK1;ACTR3;ACTR2;ARHGEF12;IRAK4;RHOA;TIRAP;TNFRSF1A;NCL;TRAF6;CLDN7;HCLS1;MYH9;GAPDH;ARF6;ROCK1;ROCK2;SRC;ACTR3B;RELA;CDC42;CYTH3;SLC9A3R1;CYTH2;CYTH4;MYO6;ABL1;MAPK1;RIPK1;FYN;FADD;WASF1;PAK2;WASF2;PTPN11;ARPC5;TUBB4B;BAIAP2;TUBB4A;MAPK12;MYO1D;MAPK11;MYO1E;MYO1C;LPAR5;ARPC2;ARPC3;BAX;PTPN6;SEC24C;MYD88 Natural killer cell mediated cytotoxicity 47/131 0 0.0001 0 0 2.4755 32.4891 PRF1;PIK3R3;PIK3CD;FASLG;KIR2DL1;PIK3R1;KIR2DL3;ICAM1;PPP3CA;PPP3R1;KLRK1;CASP3;KLRC4-KLRK1;SH3BP2;PLCG2;RAC2;MAPK1;PTK2B;FYN;KLRC1;RAC1;IFNAR2;VAV3;MAP2K2;FCER1G;KLRC2;KLRC3;SH2D1B;PRKCA;KIR3DL1;PTPN11;KIR3DL2;KIR3DL3;NCR1;NCR2;NCR3;TYROBP;LCK;GRB2;KLRD1;LCP2;PTPN6;CD247;SOS1;HCST;SOS2;CD244 Human cytomegalovirus infection 70/225 0 0.0001 0 0 2.0019 25.1393 CDKN1A;CCL4L2;PIK3CD;FASLG;CRKL;CASP9;AKAP13;PPP3CA;TBK1;GNGT2;CASP3;CREB3L2;RAC2;AKT1;ITGAV;RAC1;CCR5;PRKACB;JAK1;PDIA3;MAP2K2;ARHGEF12;PRKCA;RHOA;TNFRSF1A;CREB3;PLCB3;ADCY9;TRAF5;SOS1;SOS2;CCL3L1;ROCK1;PTGER1;ROCK2;SRC;PTGER2;GNAI3;PIK3R3;ADCY3;PIK3R1;RELA;GNAI2;PPP3R1;GNG2;GNG5;CCL5;CCL4;EIF4EBP1;MAPK1;PTK2B;RIPK1;FADD;MAP2K6;NFATC3;MAPK12;MAPK11;CDK6;CDK4;RHEB;GNAQ;GNB2;GNAS;MDM2;CTNNB1;BAX;GRB2;CALR;GNB5;CALM2 Herpes simplex virus 1 infection 133/498 0 0.0001 0 0 1.6223 20.2893 ZNF331;ZNF571;PPP1CB;TBK1;ZNF81;ZFP30;ZNF606;ZNF84;AKT1;ZNF569;ZNF568;ZNF567;ZNF600;ZNF721;ZNF324;ZNF566;MAP3K7;ZNF564;ZNF17;IFNAR2;ZNF441;PDIA3;DAXX;ZNF680;ZNF160;ZNF10;ZNF12;ZNF14;ZNF91;ZNF718;ZNF558;SRSF5;ZNF555;ZNF554;SRSF8;ZNF432;SRSF9;ZNF431;ZNF552;ZNF430;ZNF550;ZNF791;PIK3R3;PIK3R1;ZNF25;ZNF549;EIF4EBP1;ZNF669;ZNF701;ZNF700;FADD;ZNF544;ZNF665;ZNF786;ZNF420;ZNF540;ZNF141;ZNF383;ZNF140;ZNF382;TNFSF14;EIF2AK1;ZNF34;BST2;ZNF816;RHEB;BCL2;ZNF416;CALR;ZNF136;ZNF256;MYD88;ZNF773;BCL2L1;ZNF254;ZNF250;ZNF490;ZNF43;PIK3CD;ZNF44;FASLG;CASP9;ZNF808;ZNF528;CASP3;ZNF768;ZNF766;EIF2B1;ZNF124;JAK1;APAF1;ZNF480;IRAK4;ZFP90;TNFRSF1A;TRAF6;TRAF5;ZNF235;ZNF234;BIRC2;ZNF630;ZNF595;ZNF230;ZNF350;ZNF195;SRC;ZNF3;RELA;CCL5;ZNF627;ZNF746;ZNF624;ZNF227;ZNF623;ZNF226;ZNF468;ZNF224;ZNF585A;ZNF100;ZNF583;ZNF461;ZNF184;PTPN11;PPP1CA;ZNF33A;ZNF619;ZNF737;ZNF614;BAX;ZNF699;ZNF853;ZNF354A;ZFP28 Neurotrophin signaling pathway 43/119 0 0.0001 0 0 2.5017 30.8984 ZNF274;PRDM4;IRS1;MAGED1;PSEN2;PIK3R3;PIK3CD;FASLG;PIK3R1;PSEN1;FOXO3;RELA;CRKL;RAP1B;CDC42;RPS6KA3;RPS6KA5;RAP1A;ARHGDIA;RPS6KA1;ABL1;PLCG2;AKT1;MAPK1;RAC1;MAP2K7;SH2B3;MAP2K2;RIPK2;MATK;PTPN11;IRAK4;RHOA;MAPK12;MAPK11;TRAF6;CAMK4;BCL2;BAX;GRB2;SOS1;CALM2;SOS2 Vasopressin-regulated water reabsorption 21/44 0 0.0003 0 0 4.0262 46.419 DCTN6;DYNC2H1;DYNC1H1;RAB5B;RAB5C;DCTN2;DCTN1;DCTN4;ADCY3;DYNLL1;RAB11B;DYNC2LI1;CREB3;DYNC1LI1;ADCY9;ARHGDIA;CREB3L2;GNAS;STX4;PRKACB;RAB5A Sphingolipid signaling pathway 42/119 0 0.0003 0 0 2.411 27.5454 ASAH1;ROCK1;SGMS1;ROCK2;GNAI3;PIK3R3;PIK3CD;PIK3R1;PRKCZ;RELA;GNAI2;PPP2CA;SMPD2;SPTLC1;SPTLC2;PPP2R5E;SMPD1;RAC2;AKT1;MAPK1;FYN;S1PR3;RAC1;CTSD;CERS4;ABCC1;MAP2K2;FCER1G;PRKCE;SPHK1;PPP2R5B;PRKCA;RHOA;MAPK12;TNFRSF1A;MAPK11;PLCB3;PPP2R2B;GNAQ;BCL2;BAX;DEGS1 Platelet activation 43/124 0 0.0003 0 0 2.3465 26.1792 ITGB1;ROCK1;ROCK2;SRC;SNAP23;GNAI3;PIK3R3;PIK3CD;ADCY3;PIK3R1;PRKCZ;ACTB;MYL12A;PIK3R6;PIK3CG;MYL12B;GNAI2;PPP1CB;RAP1B;RAP1A;P2RY1;PLCG2;AKT1;MAPK1;FYN;PRKACB;LYN;VASP;ARHGEF12;FCER1G;PPP1R12A;RHOA;MAPK12;PPP1CA;APBB1IP;VAMP8;MAPK11;PLCB3;ADCY9;GNAQ;GNAS;LCP2;TLN1 Renal cell carcinoma 28/69 0 0.0004 0 0 3.0138 33.0854 CDKN1A;EPAS1;CUL2;SLC2A1;PIK3CD;PIK3R3;PIK3R1;CRKL;CDC42;RAP1B;RAP1A;AKT1;EP300;MAPK1;PAK6;ELOB;RAC1;VHL;PAK2;EGLN1;MAP2K2;TGFB1;ARNT;PTPN11;RBX1;GRB2;SOS1;SOS2 Leukocyte transendothelial migration 40/114 0 0.0004 0 0 2.3884 25.7849 ITGB1;NCF1;ROCK1;ROCK2;TXK;GNAI3;PIK3R3;PIK3CD;PIK3R1;ACTB;MYL12A;ICAM1;MYL12B;GNAI2;RAP1B;CDC42;RAP1A;RASSF5;PLCG2;RAC2;CTNNA1;PTK2B;RAC1;CD99;JAM3;VASP;VAV3;MSN;RHOH;CYBA;PRKCA;PTPN11;ACTN4;RHOA;MAPK12;MAPK11;CLDN7;PECAM1;CTNNB1;SIPA1 Ubiquitin mediated proteolysis 46/140 0 0.0007 0 0 2.1631 22.1827 MGRN1;UBE2D3;CUL2;KEAP1;XIAP;CBLB;UBE3A;RNF7;UBE2J2;CBL;ANAPC11;RHOBTB2;UBE2J1;CDC23;SOCS1;UBB;UBE2Q2;CDC26;UBC;ELOB;VHL;UBE2F;PIAS3;UBE2I;FBXW8;SMURF2;FBXW7;FANCL;FBXO2;UBE2E3;SIAH1;UBE2E1;SYVN1;UBE4A;UBE2G1;UBE2A;RBX1;DDB1;ITCH;TRAF6;MDM2;UBA3;UBA2;STUB1;BIRC2;UBE2M Colorectal cancer 32/86 0 0.0007 0 0 2.6159 26.7819 CDKN1A;RALA;RALB;PIK3CD;PIK3R3;PIK3R1;AREG;BBC3;CASP9;BCL2L11;CASP3;RAC2;AKT1;MAPK1;RAC1;RALGDS;APPL1;SMAD2;MAP2K2;TGFB1;GADD45B;AXIN1;RHOA;TGFBR1;APC;MSH3;BCL2;BAX;CTNNB1;GRB2;SOS1;SOS2 Longevity regulating pathway 36/102 0 0.0008 0 0 2.4087 24.1045 HDAC2;PRKAA1;IRS1;EHMT2;PRKAG1;EHMT1;PIK3R3;PIK3CD;PRKAG2;ADCY3;IRS2;PIK3R1;ADIPOR1;FOXO3;ADIPOR2;RELA;CAMKK2;ATG101;CREB3L2;EIF4EBP1;AKT1;EIF4EBP2;PRKACB;EIF4E;ATG5;APPL1;HSPA6;PRKAB1;CREB3;ADCY9;RHEB;CAMK4;CAT;BAX;HSPA1B;HSPA1A Human immunodeficiency virus 1 infection 63/212 0.0001 0.0008 0 0 1.8713 18.5199 PIK3CD;CD3G;FASLG;CD3E;CRKL;CASP9;PPP3CA;TBK1;GNGT2;CASP3;CFL1;RAC2;AKT1;AP1S1;ELOB;AP1S3;RAC1;CCR5;MAP3K7;PDIA3;MAP2K2;PRKCA;IRAK4;RBX1;TNFRSF1A;DDB1;TRAF6;TRAF5;GNAI3;PIK3R3;PIK3R1;RNF7;RELA;GNAI2;PPP3R1;GNG2;GNG5;PLCG2;PAK6;MAPK1;PTK2B;RIPK1;FADD;MAP2K7;PAK2;MAP2K6;APOBEC3C;APOBEC3G;LIMK1;NFATC3;MAPK12;BST2;MAPK11;GNAQ;GNB2;BCL2;BAX;CALR;GNB5;CD247;CALM2;MYD88;BCL2L1 Bacterial invasion of epithelial cells 29/77 0.0001 0.001 0 0 2.6658 25.7743 ITGB1;SRC;CLTC;ILK;PIK3CD;PIK3R3;WASL;PIK3R1;CBL;ACTR3B;ACTB;CRKL;CDC42;CTNNA1;RAC1;WASF1;WASF2;ACTR3;ACTR2;ARPC5;DNM1;RHOA;DNM2;MAD2L2;ARPC2;ARPC3;ELMO2;HCLS1;CTNNB1 1–20 of 315 itemsof 16 pagesDownloading entire data
You must use "Save as" or "Save link as" from the context menu (by right-clicking the button) to download the entire data.
Cluster: c6
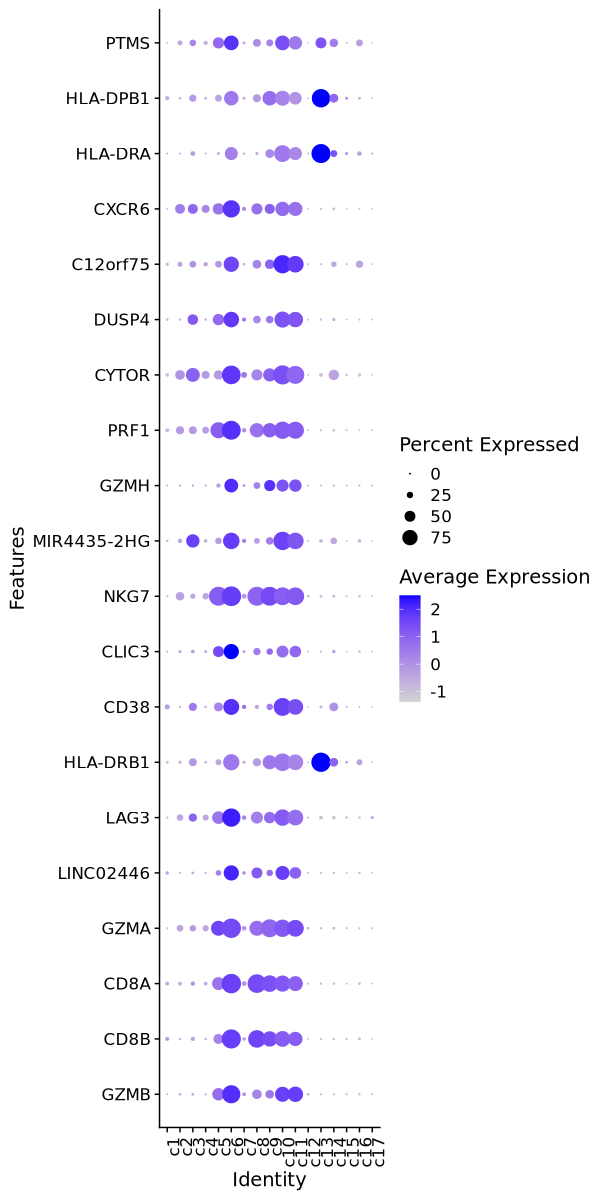
Markers
| 0 | 3.4933 | 0.907 | 0.2 | 0 | c6 | GZMB |
| 0 | 2.2207 | 0.964 | 0.264 | 0 | c6 | CD8B |
| 0 | 2.2647 | 0.982 | 0.324 | 0 | c6 | CD8A |
| 0 | 1.816 | 0.977 | 0.37 | 0 | c6 | GZMA |
| 0 | 3.0649 | 0.744 | 0.15 | 0 | c6 | LINC02446 |
| 0 | 2.3894 | 0.915 | 0.33 | 0 | c6 | LAG3 |
| 0 | 1.2165 | 0.8 | 0.227 | 0 | c6 | HLA-DRB1 |
| 0 | 2.1662 | 0.785 | 0.216 | 0 | c6 | CD38 |
| 0 | 2.6674 | 0.742 | 0.173 | 0 | c6 | CLIC3 |
| 0 | 2.5076 | 0.995 | 0.429 | 0 | c6 | NKG7 |
| 0 | 1.8407 | 0.815 | 0.251 | 0 | c6 | MIR4435-2HG |
| 0 | 3.064 | 0.665 | 0.116 | 0 | c6 | GZMH |
| 0 | 2.3405 | 0.949 | 0.402 | 0 | c6 | PRF1 |
| 0 | 1.7915 | 0.937 | 0.409 | 0 | c6 | CYTOR |
| 0 | 1.9357 | 0.765 | 0.246 | 0 | c6 | DUSP4 |
| 0 | 1.9736 | 0.75 | 0.231 | 0 | c6 | C12orf75 |
| 0 | 1.8289 | 0.861 | 0.351 | 0 | c6 | CXCR6 |
| 0 | 1.0542 | 0.62 | 0.114 | 0 | c6 | HLA-DRA |
| 0 | 1.3352 | 0.702 | 0.224 | 0 | c6 | HLA-DPB1 |
| 0 | 2.0263 | 0.714 | 0.238 | 0 | c6 | PTMS |
Downloading entire data
You must use "Save as" or "Save link as" from the context menu (by right-clicking the button) to download the entire data.
Enrichment Analysis
- The enrichment analysis results of the top biological pathways associated with the input gene set. Each bar represents a pathway, with the length of the bar indicating the number of input genes overlapping with genes in that pathway. The color intensity of the bars reflects the statistical significance of the enrichment (p-value).Image loading error!
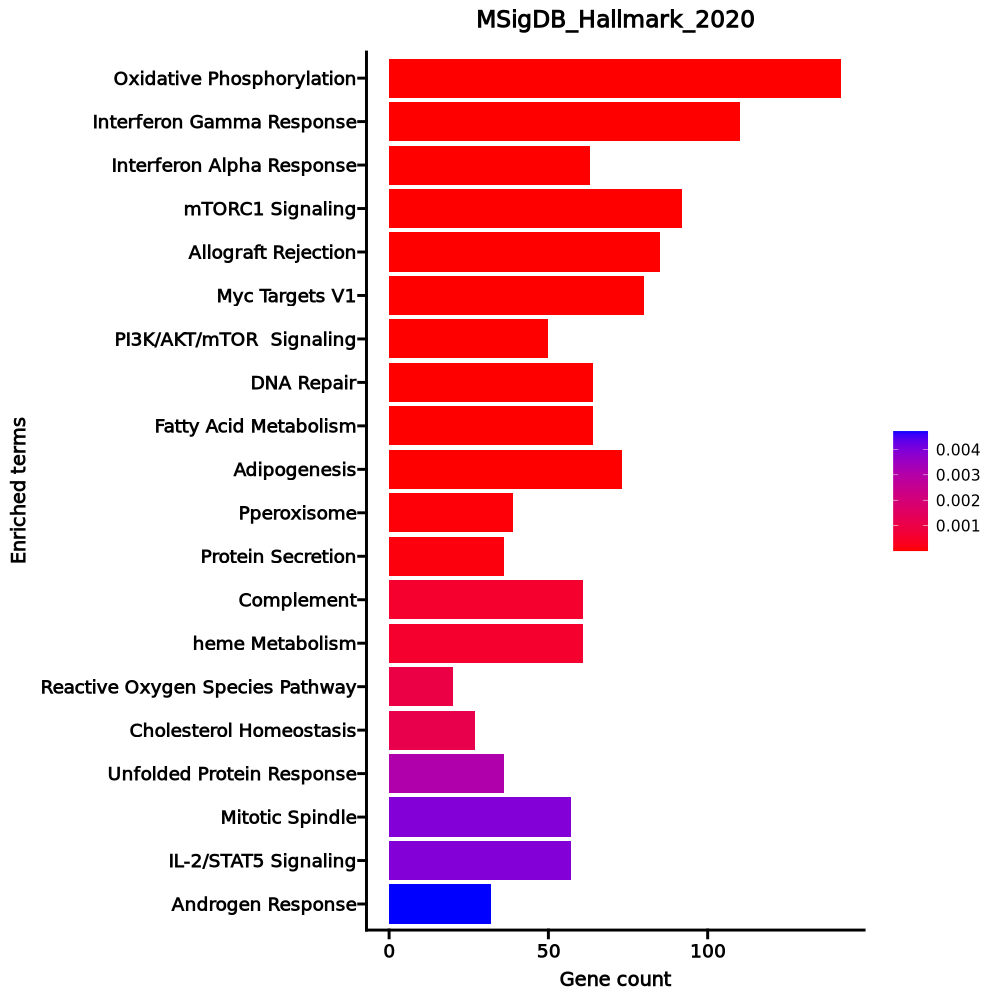
Oxidative Phosphorylation 142/200 1.206e-53 6.029e-52 0 0 9.7684 1190.2807 ISCA1;ACAA2;COX6A1;PHB2;TOMM22;MPC1;ATP6V1E1;ACAA1;ATP6V1G1;ATP6V0E1;ECH1;SDHC;SDHD;SDHA;SDHB;COX6B1;OXA1L;COX7A2L;POR;FDX1;UQCRC1;VDAC3;VDAC2;SUCLG1;VDAC1;UQCRC2;UQCRB;COX15;ATP5MC2;ATP5MC3;HTRA2;COX7A2;MRPL15;UQCRH;MRPL11;ACAT1;TIMM50;PRDX3;LDHB;LDHA;ATP6V1H;CYC1;NDUFV2;ATP6V1D;ATP5MG;ATP6V1C1;ATP5MF;COX10;DECR1;ATP6V1F;ATP5ME;SURF1;IDH1;IDH2;UQCRQ;ACO2;GPI;COX7B;MRPS15;SLC25A3;ALAS1;MRPS11;COX4I1;MRPS12;HCCS;ETFA;ETFB;MRPL34;COX7C;MRPL35;CASP7;AIFM1;NNT;IDH3B;TIMM17A;UQCRFS1;ACADM;COX8A;BCKDHA;ATP6V0B;ATP6AP1;MRPS22;NDUFC2;NDUFC1;HADHB;HADHA;NDUFS8;NDUFS7;NDUFS6;NDUFS4;NDUFS3;NDUFS2;NDUFS1;SLC25A5;SLC25A12;DLD;ATP6V0C;SLC25A11;SLC25A6;ECHS1;NDUFB7;NDUFB6;NDUFB5;NDUFB4;NDUFB3;TIMM13;NDUFB2;DLST;NDUFB1;UQCR11;UQCR10;PDHB;COX5B;COX5A;HSD17B10;ATP5F1A;ATP5F1B;MFN2;POLR2F;SLC25A20;NDUFA9;TIMM8B;ATP5PF;NDUFA8;NDUFA7;ATP5PD;NDUFA6;MDH1;NDUFA5;ATP5PB;MDH2;NDUFA4;IDH3G;NDUFA3;NDUFA2;NDUFA1;ATP5F1C;COX6C;ATP5F1D;ATP5F1E;NDUFAB1;BAX Interferon Gamma Response 110/200 5.308e-27 1.327e-25 0 0 4.8278 292.0834 IFITM3;CD86;SAMD9L;IFITM2;SPPL2A;UBE2L6;IFI35;IFI30;MT2A;NAMPT;TNFSF10;EPSTI1;PIM1;TRIM25;TRIM26;TRIM21;B2M;CMTR1;ZBP1;IL15RA;RSAD2;SP110;HLA-B;TAP1;TRAFD1;ARID5B;HLA-A;HLA-G;MTHFD2;PSME1;PSME2;CMPK2;LAP3;RBCK1;LY6E;DDX60;HIF1A;HELZ2;RNF213;KLRK1;ST8SIA4;ISOC1;SLAMF7;ST3GAL5;VCAM1;EIF2AK2;ISG15;NMI;PARP14;TOR1B;BST2;ISG20;XAF1;GPR18;HLA-DRB1;MYD88;OGFR;RTP4;CIITA;EIF4E3;ADAR;OASL;IFIH1;CASP7;CASP3;CASP4;CASP1;CD38;ITGB7;JAK2;DDX58;BPGM;TAPBP;VAMP8;PLSCR1;PSMA3;PSMA2;OAS2;IRF4;IRF1;IRF2;PELI1;IRF7;IRF8;LCP2;VAMP5;IRF9;RNF31;C1R;MVP;SRI;USP18;PSMB10;HLA-DMA;APOL6;PSMB2;CCL5;GBP4;CD74;PTPN1;GCH1;STAT1;IL10RA;GZMA;PSMB8;PML;PSMB9;ZNFX1;IL2RB;PTPN6 Interferon Alpha Response 63/97 2.93e-21 4.884e-20 0 0 7.2598 343.2353 IFITM3;RTP4;OGFR;SAMD9L;IFITM2;CSF1;UBE2L6;ADAR;IFI35;TMEM140;IFI30;OASL;IFIH1;NUB1;TRIM5;CCRL2;EPSTI1;CASP1;TRIM25;TRIM26;TRIM21;B2M;CMTR1;RSAD2;SP110;TAP1;HLA-C;TRAFD1;PARP9;PROCR;PLSCR1;PSMA3;ELF1;OAS1;IRF1;IRF2;PSME1;IRF7;CMPK2;PSME2;LAP3;CD47;IRF9;LY6E;RNF31;CNP;SAMD9;DDX60;USP18;HELZ2;MVB12A;GBP2;GBP4;CD74;EIF2AK2;ISG15;NMI;PARP14;PSMB8;PSMB9;BST2;ISG20;MOV10 mTORC1 Signaling 92/200 4.456e-16 0 0 0 3.3459 118.2688 GPI;GSK3B;TES;TFRC;UBE2D3;ITGB2;ARPC5L;SLA;ENO1;IFI30;TM7SF2;FADS2;TBK1;NAMPT;PHGDH;CTSC;FADS1;MAP2K3;ACTR3;ACTR2;STARD4;G6PD;TPI1;HMGCS1;ELOVL5;CACYBP;SYTL2;SLC7A5;ACLY;PSMA3;PSMA4;MTHFD2;PPA1;DDIT3;PSME3;MTHFD2L;HMBS;TRIB3;ETF1;HPRT1;ALDOA;EEF1E1;PPIA;GAPDH;RAB1A;PSMD14;SHMT2;PSMD13;INSIG1;PIK3R3;SLC1A4;GLRX;SLC1A5;CORO1A;ADIPOR2;GGA2;SLC9A3R1;LDHA;NFIL3;PGK1;SSR1;YKT6;LDLR;ATP6V1D;SEC11A;CYB5B;XBP1;EGLN3;SDF2L1;GOT1;HSPA4;SRD5A1;NFYC;IDH1;PDAP1;DHCR24;EIF2S2;MLLT11;SQLE;SLC6A6;RIT1;PSMC6;COPS5;PSMC4;PSAT1;SCD;PSMC2;CCNG1;BHLHE40;NMT1;TCEA1;NFKBIB Allograft Rejection 85/200 0 0 0 0 2.8968 79.1511 CD86;ITK;CSF1;GPR65;ITGB2;PRF1;UBE2D1;CD3G;FASLG;CD3E;CD3D;ETS1;CTSS;CCND3;SIT1;CCR5;JAK2;HLA-DOA;B2M;NCK1;MAP4K1;SRGN;PRKCB;F2R;TAP2;TAP1;HLA-A;HLA-G;HLA-E;TAPBP;FGR;ZAP70;CD8B;IFNG;CD8A;LCK;IRF4;ELF4;IRF7;HCLS1;IRF8;LCP2;CD47;GCNT1;WAS;MTIF2;IL2RG;HIF1A;PSMB10;CD79A;HLA-DMA;HLA-DMB;CXCR3;CCL5;CCL4;ST8SIA4;FLNA;CSK;IL12RB1;GBP2;CCR1;CD74;FYB1;TGFB1;STAT1;CDKN2A;GZMA;GALNT1;CRTAM;GLMN;GZMB;CD2;PTPRC;ABI1;BCL3;CD7;EIF3J;IL2RB;UBE2N;HLA-DRA;KLRD1;PTPN6;CD247;EIF4G3;EIF3D Myc Targets V1 80/200 0 0 0 0 2.6088 57.9177 YWHAE;HDDC2;SLC25A3;HNRNPR;PWP1;PHB2;UBE2L3;PSMD8;PSMD7;SNRPD2;YWHAQ;SNRPD1;PSMD3;RACK1;SNRPD3;MRPL9;TXNL4A;KPNA2;ACP1;CCT3;STARD7;VBP1;ILF2;RAD23B;TUFM;PSMA6;PSMA4;TFDP1;PSMA1;PSMA2;CLNS1A;VDAC3;SNRPG;SRSF3;VDAC1;ERH;ETF1;HPRT1;PPIA;SNRPA;SET;PSMD14;CSTF2;ODC1;U2AF1;PHB;COX5A;GSPT1;PSMA7;PPM1G;PRDX3;EXOSC7;LDHA;PSMB2;PSMB3;PCBP1;FAM120A;PGK1;EIF4H;SNRPB2;CYC1;BUB3;HNRNPA1;EIF4E;HNRNPA3;CBX3;DEK;EIF2S2;LSM2;LSM7;PSMC6;COPS5;PSMC4;SERBP1;NDUFAB1;EIF3J;HNRNPD;HNRNPC;SSBP1;EIF3D PI3K/AKT/mTOR Signaling 50/105 0 0 0 0 3.5457 76.0958 GSK3B;ARF1;CDKN1B;YWHAB;CAB39L;UBE2D3;CLTC;PRKAG1;SLA;FASLG;ECSIT;RPS6KA3;TBK1;RPS6KA1;CFL1;RAC1;AP2M1;NCK1;MAP2K3;ACTR3;ACTR2;PRKCB;IRAK4;TNFRSF1A;LCK;DDIT3;CSNK2B;AKT1S1;TRIB3;PFN1;CAB39;PIK3R3;IL2RG;MAPK9;GRK2;PRKAR2A;MKNK2;MAPK1;EIF4E;MAP2K6;PTPN11;PPP1CA;RIT1;ARPC3;CAMK4;UBE2N;PIN1;GRB2;MYD88;NFKBIB DNA Repair 64/150 0 0 0 0 2.9069 61.5589 ARL6IP1;ELL;MPG;GTF2B;POLB;ZNRD1;MRPL40;GUK1;MPC2;ELOA;DGCR8;NELFB;POLL;NELFCD;EDF1;VPS37B;GTF2F1;RBX1;NT5C3A;POLR1D;CMPK2;HCLS1;HPRT1;SRSF6;VPS28;GTF2A2;RALA;TSG101;CANT1;CSTF3;USP11;GMPR2;TAF9;SUPT4H1;AK3;NT5C;SDCBP;DGUOK;POLD4;POLR2E;POLR2F;POLR2G;POLR2I;POLR2J;RAE1;POLR2K;SURF1;TAF12;POLR3GL;TAF13;TAF10;ADRM1;UPF3B;GTF2H3;TARBP2;GTF2H5;NUDT21;ERCC3;AGO4;ERCC4;RPA3;ERCC8;ITPA;ADA Fatty Acid Metabolism 64/158 0 0 0 0 2.6581 49.6355 ACAA2;UBE2L6;HCCS;LGALS1;AUH;UROD;IDH3B;NBN;ACADM;ACAA1;ACADS;ACOT8;GABARAPL1;ADSL;HMGCS1;ELOVL5;ECH1;ACSL5;SDHC;ACSL4;SDHD;SDHA;HADHB;ACOX1;ACOT2;PSME1;ERP29;SUCLG1;PPARA;ALDOA;DLD;BLVRA;ALDH9A1;ECHS1;HPGD;ODC1;DLST;PDHB;HSD17B11;HSD17B7;ADIPOR2;HSD17B10;PTS;HMGCL;LDHA;NTHL1;TP53INP2;PCBD1;D2HGDH;ACSS1;DECR1;MDH1;MDH2;IDH3G;IDH1;UROS;DHCR24;PRDX6;GSTZ1;GRHPR;FASN;OSTC;ACO2;CRAT Adipogenesis 73/200 0 0 0 0 2.2444 35.68 SLC25A1;SCARB1;COX7B;MTCH2;ACAA2;ARAF;GHITM;ETFB;COX6A1;SCP2;AIFM1;DBT;PIM3;ACADM;ACADS;COX8A;BCKDHA;JAGN1;CHUK;ECH1;TALDO1;ATP1B3;SDHC;SDHB;ACLY;POR;TST;ACOX1;CAT;UQCRC1;NDUFS3;SUCLG1;PREB;ALDOA;TKT;DLD;ECHS1;NDUFB7;UQCR11;MRPL15;UQCR10;SLC1A5;TANK;ADIPOR2;PRDX3;BCL2L13;SAMM50;DDT;UCP2;STOM;CYC1;DECR1;STAT5A;NDUFA5;RIOK3;MDH2;IDH3G;IDH1;SQOR;COQ9;DNAJC15;PEX14;COQ5;SOD1;UCK1;REEP5;UQCRQ;LPCAT3;CCNG2;NDUFAB1;NMT1;ACO2;CRAT Pperoxisome 39/104 0.0001 0.0002 0 0 2.3324 23.0883 SLC35B2;ABCD2;CTBP1;MVP;VPS4B;PEX11B;HSD17B11;HMGCL;PRDX5;ATXN1;SCP2;NUDT19;ISOC1;TSPO;ACAA1;ABCD1;FADS1;FIS1;FDPS;ACOT8;CADM1;ELOVL5;IDH1;ECH1;IDH2;ACSL5;ACSL4;DHCR24;PEX2;PEX14;SOD1;CDK7;ERCC3;ACOX1;CAT;ITGB1BP1;SLC27A2;CRAT;ALDH9A1 Protein Secretion 36/96 0.0001 0.0004 0 0 2.3314 21.5658 NAPA;COPB2;ARF1;TSG101;SGMS1;COPB1;VPS4B;GOSR2;CLTC;SNAP23;CLTA;NAPG;RPS6KA3;LMAN1;GOLGA4;AP1G1;LAMP2;AP2S1;ATP6V1H;MAPK1;YKT6;AP2M1;CTSC;RAB2A;GBF1;IGF2R;SOD1;VAMP7;RER1;RAB14;TMX1;YIPF6;ERGIC3;VAMP4;SEC22B;COPE Complement 61/200 0.0005 0.0019 0 0 1.7072 12.8286 PLEK;PREP;CBLB;CTSS;PIK3CG;CASP9;CASP7;GNGT2;CSRP1;CASP3;LAMP2;CASP4;PIM1;CASP1;JAK2;CTSD;CTSC;DUSP5;USP8;ANXA5;RHOG;SIRT6;PLSCR1;LCK;IRF1;FDX1;IRF2;IRF7;LCP2;LAP3;PFN1;DGKH;CEBPB;USP16;C1R;WAS;GNAI3;GATA3;RNF4;RASGRP1;PIK3R5;GNAI2;PPP4C;GNG2;SPOCK2;CCL5;FYN;APOBEC3F;APOBEC3G;ERAP2;GZMA;GZMB;ATOX1;PSMB9;EHD1;GZMK;RABIF;GNB2;CALM3;GRB2;MSRB1 heme Metabolism 61/200 0.0005 0.0019 0 0 1.7072 12.8286 ISCA1;NARF;TFRC;GDE1;BACH1;NUDT4;CCDC28A;PSMD9;CCND3;NNT;UROD;RNF19A;BSG;CDC27;LAMP2;ACP5;CIR1;PGLS;FBXO7;FBXO9;MAP2K3;BNIP3L;ARHGEF12;GLRX5;NCOA4;PPP2R5B;SLC30A1;BPGM;TENT5C;RNF123;MINPP1;TFDP2;HMBS;CAT;ATG4A;TOP1;OPTN;BLVRA;KDM7A;GYPC;FECH;DCUN1D1;HTRA2;PPOX;SDCBP;SEC14L1;UCP2;TSPAN5;DCAF11;MARK3;RIOK3;EIF2AK1;UROS;SLC10A3;SLC25A38;SYNJ1;TCEA1;LRP10;LPIN2;TMEM9B;PICALM Reactive Oxygen Species Pathway 20/49 0.001 0.0032 0 0 2.6745 18.5548 G6PD;EGLN2;NDUFA6;NDUFB4;GLRX;LSP1;GLRX2;TXN;PRDX6;ATOX1;SOD1;PTPA;SBNO2;SELENOS;STK25;CAT;NDUFS2;MBP;HMOX2;LAMTOR5 Cholesterol Homeostasis 27/74 0.0011 0.0035 0 0 2.2291 15.1591 GLDC;HSD17B7;TM7SF2;ACTG1;FADS2;NFIL3;TP53INP1;STX5;FBXO6;LDLR;FDFT1;FDPS;ABCA2;STARD4;GSTM2;HMGCS1;ECH1;ANXA5;SREBF2;SQLE;PLSCR1;FABP5;SCD;ETHE1;FASN;MVD;TRIB3 Unfolded Protein Response 36/113 0.0031 0.0091 0 0 1.8147 10.4858 CEBPB;DCTN1;POP4;GOSR2;SLC1A4;HERPUD1;TATDN2;EXOSC4;KIF5B;EXOSC9;EIF4EBP1;SSR1;EIF4E;SEC11A;EXOSC1;ZBTB17;XBP1;NFYB;EIF2AK3;LSM1;WIPI1;EEF2;PDIA6;YWHAZ;YIF1A;DNAJC3;SLC7A5;CNOT6;SPCS1;MTHFD2;PSAT1;CNOT2;PREB;ATP6V0D1;DCP2;ATF4 Mitotic Spindle 57/199 0.0039 0.0103 0 0 1.5597 8.6398 CEP57;YWHAE;SMC4;LMNB1;PREX1;AKAP13;PPP4R2;CAPZB;KIF5B;CDC27;CEP250;NCK1;RALBP1;ARHGEF12;PLEKHG2;RFC1;MAP1S;CSNK1D;ACTN4;RHOF;CLIP1;BIN1;ARHGEF3;MYH9;ATG4B;EZR;MAPRE1;KPTN;ARHGEF7;ARL8A;ARF6;PAFAH1B1;PIF1;STAU1;ROCK1;TUBGCP2;PXN;NEDD9;KATNB1;CDC42;ABR;BCL2L11;KIF3B;FLNA;PCNT;MARK4;WASF2;PCGF5;RANBP9;MYO9B;NDC80;MYO1E;NIN;TAOK2;ABI1;NF1;MAP3K11 IL-2/STAT5 Signaling 57/199 0.0039 0.0103 0 0 1.5597 8.6398 IFITM3;CD86;CSF1;CD81;GPR65;ITGAE;CCND3;GLIPR2;CASP3;NFKBIZ;TNFSF10;PIM1;CTLA4;MAP3K8;PHLDA1;EOMES;GABARAPL1;PRKCH;GSTO1;ANXA4;RHOH;FAM126B;TNFRSF1B;ADAM19;PLSCR1;IRF4;MAPKAPK2;IRF8;PLPP1;ODC1;FURIN;SLC1A5;CST7;SYNGR2;NFIL3;PLAGL1;LRRC8C;SNX9;DCPS;GBP4;XBP1;IL10RA;TNFRSF9;PRAF2;IGF2R;HOPX;BATF;MYO1E;UCK2;SYT11;BHLHE40;IL2RB;GALM;MXD1;EEF1AKMT1;CDC42SE2;BCL2L1 Androgen Response 32/100 0.0047 0.0118 0 0 1.8258 9.7791 SRP19;B4GALT1;HPGD;INSIG1;ABHD2;SRF;STK39;GNAI3;DBI;SAT1;MYL12A;UBE2J1;RPS6KA3;LMAN1;CCND3;ZMIZ1;PTK2B;B2M;FADS1;RAB4A;UBE2I;HMGCS1;TMEM50A;ELOVL5;NCOA4;ADRM1;ARID5B;DHCR24;SCD;CENPN;PLPP1;FKBP5 1–20 of 50 itemsof 3 pagesDownloading entire data
You must use "Save as" or "Save link as" from the context menu (by right-clicking the button) to download the entire data.
- The enrichment analysis results of the top biological pathways associated with the input gene set. Each bar represents a pathway, with the length of the bar indicating the number of input genes overlapping with genes in that pathway. The color intensity of the bars reflects the statistical significance of the enrichment (p-value).Image loading error!
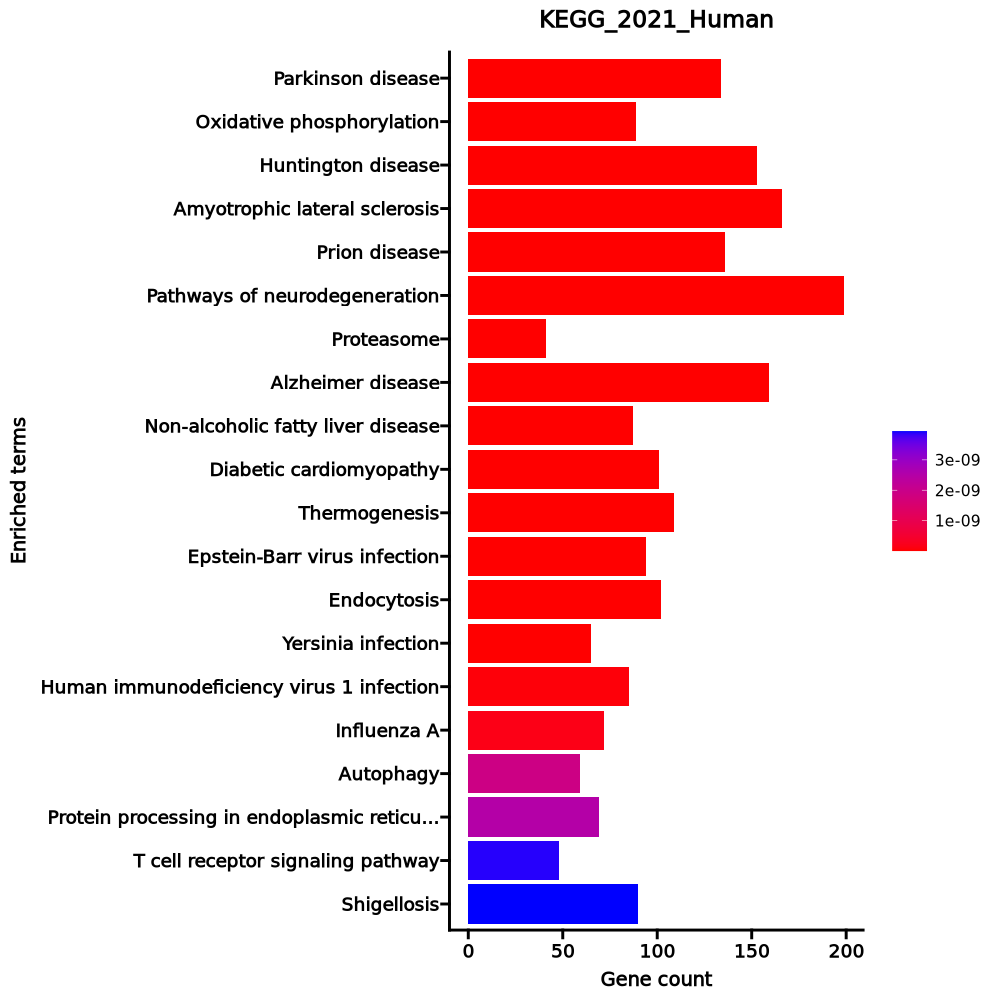
Parkinson disease 134/249 2.622e-31 8.234e-29 0 0 4.6231 325.538 NDUFA13;NDUFA11;NDUFA12;NDUFA10;UBE2L6;PARK7;COX6A1;UBE2L3;TXN2;PSMD8;PSMD9;PSMD6;PSMD7;PSMD4;PSMD2;KIF5B;PSMD3;DAXX;SDHC;SDHD;SDHA;SDHB;COX6B1;COX7A2L;DDIT3;UQCRC1;VDAC3;PPIF;VDAC2;VDAC1;UQCRC2;ATF4;PSMD11;NDUFB10;PSMD14;UQCRB;NDUFB11;PSMD13;ATP5MC2;ATP5MC3;HTRA2;COX7A2;TXN;UBE2J2;UQCRH;UBE2J1;KLC2;UBB;CYC1;NDUFV2;XBP1;EIF2AK3;SEM1;UQCRQ;CALM3;UBA1;BCL2L1;COX7B;COX4I1;COX7C;CASP9;CASP3;UQCRFS1;COX8A;NDUFC2;NDUFC1;PSMA5;PSMA6;PSMA3;PSMA4;NDUFS8;PSMA1;ADORA2A;NDUFS7;PSMA2;NDUFS6;NDUFS5;NDUFS4;NDUFS3;NDUFS2;NDUFS1;SLC25A5;SLC25A6;NDUFB9;NDUFB7;NDUFB6;NDUFB5;NDUFB4;NDUFB3;GNAI3;NDUFB2;NDUFB1;UQCR11;UQCR10;COX5B;COX5A;PSMA7;GNAI2;PSMB6;PSMB7;MAPK9;ATP5F1A;PSMB4;ATP5F1B;PSMB2;PSMB3;PSMB1;MFN2;NDUFA9;ATP5PF;NDUFA8;NDUFA7;ATP5PD;NDUFA6;NDUFA5;ATP5PB;NDUFA4;NDUFA3;ADRM1;NDUFA2;NDUFA1;UBE2G1;ATP5F1C;COX6C;ATP5F1D;ATP5F1E;PSMC5;PSMC6;PSMC3;PSMC4;PSMC1;NDUFAB1;PSMC2;BAX Oxidative phosphorylation 89/133 6.012e-31 8.85e-29 0 0 7.9712 554.6853 NDUFA13;COX7B;NDUFA11;NDUFA12;COX4I1;NDUFA10;COX6A1;COX7C;UQCRFS1;ATP6V1E1;COX8A;ATP6V1G1;ATP6V0B;ATP6V0E1;ATP6AP1;NDUFC2;SDHC;NDUFC1;SDHD;SDHA;SDHB;COX6B1;COX7A2L;NDUFS8;NDUFS7;PPA1;NDUFS6;NDUFS5;NDUFS4;UQCRC1;ATP6V1B2;NDUFS3;NDUFS2;NDUFS1;UQCRC2;ATP6V0D1;ATP6V0C;ATP6V1A;NDUFB9;NDUFB7;NDUFB10;UQCRB;NDUFB6;COX15;NDUFB11;NDUFB5;NDUFB4;NDUFB3;ATP5MC2;NDUFB2;ATP5MC3;NDUFB1;COX7A2;UQCR11;UQCR10;COX5B;COX5A;UQCRH;ATP5F1A;ATP5F1B;ATP6V0A2;ATP6V1H;CYC1;NDUFV2;ATP5MG;ATP6V1D;ATP5MF;ATP6V1C1;COX10;ATP5ME;ATP6V1F;NDUFA9;ATP5PF;NDUFA8;NDUFA7;ATP5PD;NDUFA6;NDUFA5;ATP5PB;NDUFA4;NDUFA3;NDUFA2;NDUFA1;ATP5F1C;COX6C;ATP5F1D;ATP5F1E;UQCRQ;NDUFAB1 Huntington disease 153/306 8.456e-31 8.85e-29 0 0 3.977 275.3887 NDUFA13;NDUFA11;NDUFA12;NDUFA10;COX6A1;PSMD8;PSMD9;PSMD6;PSMD7;PSMD4;CREB3L4;PSMD2;KIF5B;PSMD3;AP2M1;SDHC;SDHD;SDHA;ATG13;SDHB;COX6B1;COX7A2L;UQCRC1;VDAC3;PPIF;TBPL1;VDAC2;VDAC1;UQCRC2;STX1A;PSMD11;NDUFB10;PSMD14;UQCRB;NDUFB11;PSMD13;ATP5MC2;ATP5MC3;COX7A2;UQCRH;KLC2;ATG101;NRBF2;CYC1;MAP2K7;NDUFV2;SEM1;UQCRQ;ATG2A;DNAL4;COX7B;COX4I1;CLTC;CLTB;CLTA;AP2A1;COX7C;CASP9;ACTR1A;ACTR1B;CASP3;RB1CC1;UQCRFS1;COX8A;DNAI2;TBP;GPX7;NDUFC2;NDUFC1;WIPI1;WIPI2;PSMA5;PSMA6;CREB3;PSMA3;PSMA4;NDUFS8;PSMA1;NDUFS7;PSMA2;NDUFS6;NDUFS5;NDUFS4;NDUFS3;NDUFS2;NDUFS1;SLC25A5;SLC25A6;DCTN6;BECN1;DCTN5;NDUFB9;NDUFB7;DCTN2;NDUFB6;DCTN1;HDAC1;NDUFB5;NDUFB4;DCTN3;NDUFB3;NDUFB2;NDUFB1;UQCR11;UQCR10;COX5B;COX5A;PSMA7;PSMB6;PSMB7;MAPK9;ATP5F1A;PSMB4;ATP5F1B;PSMB2;PSMB3;PSMB1;AP2S1;POLR2E;POLR2F;POLR2G;POLR2I;POLR2J;POLR2K;POLR2L;NDUFA9;POLR2J3;ATP5PF;NDUFA8;NDUFA7;ATP5PD;NDUFA6;NDUFA5;ATP5PB;NDUFA4;NDUFA3;ADRM1;NDUFA2;NDUFA1;ATP5F1C;COX6C;ATP5F1D;ATP5F1E;SOD1;PSMC5;REST;PSMC6;PSMC3;PSMC4;PSMC1;NDUFAB1;PSMC2;BAX Amyotrophic lateral sclerosis 166/364 2.111e-27 1.643e-25 0 0 3.3357 204.8859 NDUFA13;NDUFA11;NDUFA12;NDUFA10;COX6A1;ACTB;ACTG1;GLE1;PSMD8;PSMD9;PSMD6;PSMD7;TBK1;PSMD4;PSMD2;KIF5B;PSMD3;MAP2K3;GABARAPL2;DAXX;GABARAPL1;ANXA11;SDHC;SDHD;SDHA;ATG13;SDHB;COX6B1;COX7A2L;DDIT3;UQCRC1;SRSF3;VDAC1;UQCRC2;PFN1;OPTN;ATF4;VCP;PSMD11;NDUFB10;PSMD14;UQCRB;NDUFB11;PSMD13;ATP5MC2;ATP5MC3;COX7A2;GABARAP;UQCRH;KLC2;ATG101;NRBF2;CYC1;NDUFV2;MAP2K6;XBP1;EIF2AK3;SEM1;UQCRQ;ATG2A;DNAL4;BCL2L1;COX7B;COX4I1;WDR41;NXT2;COX7C;CASP9;ACTR1A;ACTR1B;CASP3;RB1CC1;CASP1;UQCRFS1;RAC1;RAB8A;COX8A;SEC13;DNAI2;GPX7;NDUFC2;NDUFC1;WIPI1;WIPI2;TNFRSF1B;TOMM40L;TNFRSF1A;PSMA5;PSMA6;PSMA3;PSMA4;NDUFS8;PSMA1;NDUFS7;PSMA2;NDUFS6;NDUFS5;CAT;NDUFS4;NDUFS3;NDUFS2;NDUFS1;DCTN6;BECN1;DCTN5;NDUFB9;RAB1A;NDUFB7;DCTN2;NDUFB6;DCTN1;NDUFB5;NDUFB4;DCTN3;NDUFB3;DERL1;NDUFB2;NDUFB1;UQCR11;UQCR10;COX5B;COX5A;TANK;PSMA7;PSMB6;PSMB7;ATP5F1A;PSMB4;ATP5F1B;PSMB2;PSMB3;PSMB1;BID;HNRNPA1;RAE1;NDUFA9;ATP5PF;NDUFA8;HNRNPA3;NDUFA7;ATP5PD;NDUFA6;NDUFA5;ATP5PB;BAD;NDUFA4;NDUFA3;ADRM1;NDUFA2;NDUFA1;ATP5F1C;COX6C;ATP5F1D;ATP5F1E;SOD1;MAPK11;PSMC5;CCS;PSMC6;PSMC3;PSMC4;PSMC1;NDUFAB1;PSMC2;BAX;NUP37 Prion disease 136/273 2.615e-27 1.643e-25 0 0 3.9351 240.8598 ATF2;NDUFA13;NDUFA11;NDUFA12;NDUFA10;COX6A1;PSMD8;PSMD9;PSMD6;PSMD7;PSMD4;CREB3L4;PSMD2;KIF5B;PSMD3;CSNK2A1;CSNK2A2;CYBA;SDHC;SDHD;SDHA;SDHB;COX6B1;COX7A2L;DDIT3;CSNK2B;UQCRC1;VDAC3;PPIF;VDAC2;VDAC1;UQCRC2;ATF4;NOTCH1;PSMD11;NDUFB10;PSMD14;UQCRB;NDUFB11;PSMD13;ATP5MC2;PIK3R3;ATP5MC3;COX7A2;UQCRH;KLC2;CYC1;NDUFV2;EIF2AK3;SEM1;UQCRQ;GSK3B;COX7B;COX4I1;PIK3CD;COX7C;CASP9;CASP3;RAC2;UQCRFS1;RAC1;COX8A;NDUFC2;NDUFC1;PSMA5;PSMA6;CREB3;PSMA3;PSMA4;NDUFS8;PSMA1;NDUFS7;PSMA2;NDUFS6;NDUFS5;NDUFS4;NDUFS3;NDUFS2;NDUFS1;SLC25A5;SLC25A6;NDUFB9;NDUFB7;ATF6B;NDUFB6;NDUFB5;NDUFB4;NDUFB3;NDUFB2;NDUFB1;UQCR11;UQCR10;COX5B;COX5A;PSMA7;PSMB6;PSMB7;MAPK9;ATP5F1A;PSMB4;ATP5F1B;PSMB2;PSMB3;CCL5;PSMB1;MAPK1;FYN;MAPK3;NDUFA9;ATP5PF;NDUFA8;NDUFA7;ATP5PD;NDUFA6;NDUFA5;ATP5PB;BAD;NDUFA4;NDUFA3;ADRM1;NDUFA2;NDUFA1;ATP5F1C;COX6C;ATP5F1D;ATP5F1E;SOD1;MAPK11;PSMC5;PSMC6;PSMC3;PSMC4;PSMC1;NDUFAB1;PSMC2;BAX Pathways of neurodegeneration 199/475 9.965e-27 5.215e-25 0 0 2.8785 172.3394 ARAF;UBE2L6;UBE2L3;PSMD8;PSMD9;PSMD6;PSMD7;TBK1;FRAT2;PSMD4;PSMD2;PSMD3;GABARAPL2;DAXX;GABARAPL1;CSNK2A1;PRKCB;CSNK2A2;ATG13;COX7A2L;DDIT3;CSNK2B;UQCRC1;VDAC3;VDAC2;VDAC1;UQCRC2;OPTN;STX1A;ATF4;UBE2J2;GABARAP;UBE2J1;NRBF2;FADD;XBP1;EIF2AK3;ATG2A;CALM3;COX7B;WDR41;COX7C;ACTR1A;ACTR1B;RAC1;RAB8A;COX8A;TOMM40L;PSMA5;PSMA6;PSMA3;PSMA4;PSMA1;PSMA2;DERL1;UQCR11;UQCR10;COX5B;TANK;COX5A;PSMA7;PSMB6;PSMB7;NRAS;PSMB4;ATP5F1A;ATP5F1B;PSMB2;PSMB3;PSMB1;MFN2;BID;ATP5PF;ATP5PD;CSNK1A1;ATP5PB;UBE2G1;ATP5F1C;COX6C;ATP5F1D;ATP5F1E;PSMC5;PSMC6;PSMC3;PSMC4;PSMC1;PSMC2;NDUFAB1;NDUFA13;CSF1;NDUFA11;NDUFA12;NDUFA10;PARK7;COX6A1;KIF5B;CAPN2;CAPN1;MAP2K3;MAP2K1;MAP2K2;SDHC;SDHD;SDHA;SDHB;COX6B1;PPIF;PPID;VCP;PSMD11;UQCRB;NDUFB10;PSMD14;NDUFB11;PSMD13;ATP5MC2;ATP5MC3;HTRA2;COX7A2;UQCRH;ATXN1;KLC2;UBB;ATG101;DVL3;CYC1;MAP2K7;NDUFV2;MAP2K6;SEM1;CDK5;UQCRQ;UBA1;DNAL4;BCL2L1;GSK3B;COX4I1;FASLG;CASP9;CASP7;CASP3;RB1CC1;UQCRFS1;DNAI2;AXIN1;GPX7;NDUFC2;NDUFC1;WIPI1;WIPI2;TNFRSF1B;TNFRSF1A;NDUFS8;NDUFS7;NDUFS6;NDUFS5;CAT;NDUFS4;NDUFS3;NDUFS2;NDUFS1;SLC25A5;SLC25A6;DCTN6;BECN1;NDUFB9;RAB1A;DCTN5;NDUFB7;NDUFB6;DCTN2;NDUFB5;DCTN1;NDUFB4;NDUFB3;DCTN3;NDUFB2;NDUFB1;HSD17B10;MAPK9;MAPK1;BAK1;MAPK3;NDUFA9;NDUFA8;NDUFA7;NDUFA6;NDUFA5;NDUFA4;BAD;NDUFA3;ADRM1;NDUFA2;NDUFA1;SOD1;MAPK11;CCS;BAX;KRAS Proteasome 41/46 2.575e-23 1.155e-21 0 0 32.012 1665.0607 PSMD11;PSMD14;PSMD13;POMP;PSMA7;PSMB10;PSMB6;PSMD8;PSMB7;PSMD9;PSMB4;PSMD6;PSMD7;PSMB2;PSMD4;PSMB3;PSMD2;PSMB1;PSMD3;PSMF1;ADRM1;PSMB8;PSMB9;PSMA5;SEM1;PSMA6;PSMA3;PSMC5;PSMA4;PSMC6;IFNG;PSMA1;PSMC3;PSMA2;PSMC4;PSMC1;PSME3;PSMC2;PSME4;PSME1;PSME2 Alzheimer disease 159/369 4.292e-23 1.685e-21 0 0 3.0048 154.7559 NDUFA13;CSF1;NDUFA11;NDUFA12;NDUFA10;ARAF;COX6A1;PSMD8;PSMD9;PSMD6;FRAT2;PSMD7;PSMD4;AKT2;PSMD2;KIF5B;PSMD3;CAPN2;CAPN1;MAP2K1;MAP2K2;CSNK2A1;CSNK2A2;SDHC;SDHD;SDHA;ATG13;SDHB;COX6B1;COX7A2L;DDIT3;CSNK2B;UQCRC1;VDAC3;PPIF;VDAC2;VDAC1;UQCRC2;PPID;ATF4;PSMD11;NDUFB10;PSMD14;UQCRB;NDUFB11;PSMD13;ATP5MC2;PIK3R3;ATP5MC3;COX7A2;UQCRH;APH1A;KLC2;ATG101;DVL3;FADD;NRBF2;CYC1;MAP2K7;NDUFV2;XBP1;EIF2AK3;EIF2AK2;SEM1;CDK5;UQCRQ;ATG2A;CALM3;GSK3B;COX7B;COX4I1;PIK3CD;COX7C;CASP9;CASP7;CASP3;RB1CC1;UQCRFS1;COX8A;PSENEN;CHUK;AXIN1;NDUFC2;NDUFC1;WIPI1;WIPI2;TNFRSF1A;PSMA5;PSMA6;PSMA3;PSMA4;NDUFS8;PSMA1;NDUFS7;PSMA2;NDUFS6;NDUFS5;NDUFS4;NDUFS3;NDUFS2;NDUFS1;SLC25A5;GAPDH;SLC25A6;BECN1;NDUFB9;NDUFB7;NDUFB6;NDUFB5;NDUFB4;NDUFB3;NDUFB2;NDUFB1;UQCR11;UQCR10;COX5B;COX5A;HSD17B10;PSMA7;PSMB6;PSMB7;MAPK9;ATP5F1A;NRAS;PSMB4;ATP5F1B;PSMB2;PSMB3;PSMB1;MAPK1;BID;MAPK3;NDUFA9;ATP5PF;NDUFA8;NDUFA7;ATP5PD;NDUFA6;NDUFA5;ATP5PB;CSNK1A1;BAD;NDUFA4;NDUFA3;ADRM1;NDUFA2;NDUFA1;ATP5F1C;COX6C;ATP5F1D;ATP5F1E;PSMC5;PSMC6;PSMC3;PSMC4;PSMC1;NDUFAB1;PSMC2;KRAS Non-alcoholic fatty liver disease 87/155 1.889e-22 6.59e-21 0 0 5.0318 251.6945 GSK3B;NDUFA13;COX7B;GSK3A;NDUFA11;NDUFA12;COX4I1;NDUFA10;PRKAG1;PIK3CD;FASLG;COX6A1;COX7C;CASP7;AKT2;CASP3;MLX;UQCRFS1;RAC1;COX8A;NDUFC2;SDHC;NDUFC1;SDHD;SDHA;SDHB;COX6B1;TNFRSF1A;COX7A2L;NDUFS8;NDUFS7;NDUFS6;DDIT3;NDUFS5;NDUFS4;UQCRC1;NDUFS3;NDUFS2;NDUFS1;UQCRC2;PPARA;ATF4;NDUFB9;NDUFB7;NDUFB10;UQCRB;NDUFB6;NDUFB11;NDUFB5;NDUFB4;NDUFB3;NDUFB2;PIK3R3;NDUFB1;COX7A2;UQCR11;UQCR10;COX5B;ADIPOR2;COX5A;UQCRH;CDC42;MAPK9;BCL2L11;CYC1;NDUFV2;BID;NDUFA9;NDUFA8;XBP1;NDUFA7;TGFB1;NDUFA6;NDUFA5;NDUFA4;NDUFA3;NDUFA2;EIF2AK3;NDUFA1;NR1H3;COX6C;MAPK11;ITCH;UQCRQ;NDUFAB1;BAX;MAP3K11 Diabetic cardiomyopathy 101/203 1.421e-20 4.463e-19 0 0 3.8995 178.2092 NDUFA13;NDUFA11;NDUFA12;NDUFA10;COX6A1;PPP1CC;MPC1;AKT2;MPC2;PDK2;G6PD;PRKCB;CYBA;SDHC;SDHD;SDHA;SDHB;COX6B1;COX7A2L;UQCRC1;VDAC3;PPIF;VDAC2;VDAC1;UQCRC2;NDUFB10;UQCRB;NDUFB11;ATP5MC2;PIK3R3;ATP5MC3;COX7A2;PRKCZ;UQCRH;CYC1;NDUFV2;TGFB1;UQCRQ;GSK3B;COX7B;COX4I1;PIK3CD;COX7C;GYS1;RAC2;UQCRFS1;RAC1;CTSD;COX8A;PARP1;NDUFC2;NDUFC1;TGFBR2;NDUFS8;NDUFS7;NDUFS6;NDUFS5;NDUFS4;NDUFS3;NDUFS2;NDUFS1;PPARA;SLC25A5;GAPDH;SLC25A6;NDUFB9;NDUFB7;NDUFB6;NDUFB5;NDUFB4;NDUFB3;NDUFB2;NDUFB1;UQCR11;UQCR10;PDHB;COX5B;COX5A;PTPA;MAPK9;ATP5F1A;ATP5F1B;NDUFA9;ATP5PF;NDUFA8;NDUFA7;ATP5PD;NDUFA6;NDUFA5;ATP5PB;NDUFA4;NDUFA3;NDUFA2;NDUFA1;ATP5F1C;COX6C;ATP5F1D;ATP5F1E;PPP1CA;MAPK11;NDUFAB1 Thermogenesis 109/232 1.195e-19 3.411e-18 0 0 3.4922 152.1598 ATF2;NDUFA13;SMARCB1;NDUFA11;NDUFA12;NDUFA10;COX6A1;ACTB;ACTG1;RPS6KA3;CREB3L4;RPS6KA1;DPF3;MAP2K3;ACSL5;ACSL4;SDHC;SDHD;SDHA;SDHB;COX6B1;COX7A2L;UQCRC1;UQCRC2;COX19;COX16;NDUFB10;UQCRB;COX15;NDUFB11;ATP5MC2;ATP5MC3;COX7A2;UQCRH;COX14;CYC1;NDUFV2;ATP5MG;ATP5MF;COX10;ATP5ME;COA3;RHEB;UQCRQ;NDUFAF5;GRB2;COX7B;COX4I1;PRKAG1;COX7C;MLST8;UQCRFS1;COA6;COA5;COX8A;NDUFC2;SIRT6;NDUFC1;CREB3;NDUFS8;NDUFS7;NDUFS6;NDUFS5;AKT1S1;NDUFS4;NDUFS3;NDUFS2;NDUFS1;NDUFB9;SMARCD1;SMARCD2;NDUFB7;NDUFB6;NDUFB5;NDUFB4;NDUFB3;NDUFB2;NDUFB1;UQCR11;UQCR10;COX5B;ADCY7;COX5A;ATP5F1A;NRAS;SLC25A29;ATP5F1B;SLC25A20;NDUFA9;SMARCE1;ATP5PF;NDUFA8;NDUFA7;ATP5PD;NDUFA6;NDUFA5;ATP5PB;NDUFA4;NDUFA3;NDUFA2;NDUFA1;ATP5F1C;COX6C;ATP5F1D;ATP5F1E;MAPK11;NDUFAB1;RPS6KB2;KRAS Epstein-Barr virus infection 94/202 8.446e-17 0 0 0 3.4204 126.5886 CDKN1B;PIK3CD;CD3G;RBPJ;CD3E;CD3D;PSMD8;CASP9;PSMD6;CCND3;PSMD7;TBK1;PSMD4;AKT2;PSMD2;CASP3;PSMD3;CIR1;IKBKG;RAC1;HLA-DOA;B2M;IKBKE;JAK3;HLA-DPA1;JAK1;MAP2K3;ENTPD1;CHUK;DDX58;HLA-B;TAP2;HLA-C;TAP1;HLA-A;TYK2;IRAK4;HLA-F;HLA-G;RUNX3;HLA-E;TAPBP;NCOR2;IRF3;OAS1;OAS2;TRAF3;IRF7;IRF9;HLA-DQB1;PSMD11;PSMD14;PSMD13;HDAC1;PIK3R3;RELB;MAPK9;HLA-DMA;HLA-DMB;BCL2L11;PLCG2;E2F3;FADD;CD58;BAK1;BID;MAP2K7;MAP2K6;HLA-DRB5;STAT1;ADRM1;EIF2AK2;ISG15;SEM1;MAPK11;PSMC5;MAVS;SNW1;PSMC6;PSMC3;PSMC4;PSMC1;PSMC2;HLA-DPB1;MDM2;HLA-DRA;BAX;TAB1;CD247;NFKBIE;MAP3K14;HLA-DRB1;MYD88;NFKBIB Endocytosis 102/252 0 0 0 0 2.6705 76.7095 TFRC;WIPF1;WIPF2;ARPC5L;CBLB;KIF5B;AP2M1;WASHC3;SH3GLB1;USP8;IST1;HLA-B;HLA-C;HLA-A;HLA-F;HLA-G;HLA-E;RNF41;ACAP2;BIN1;RAB35;CHMP4B;CHMP4A;STAMBP;VPS25;STAM2;VPS28;RAB5C;TSG101;AGAP2;VPS26B;PRKCZ;SNX3;SNX4;SNX1;GRK3;GRK2;PIP5K1A;RAB11FIP4;SNX5;SNX6;RAB4A;IQSEC1;IQSEC3;ARPC4;SNF8;ARPC5;IGF2R;EHD1;ARPC2;ARPC3;CHMP2A;MDM2;ARF3;ARF4;ARF1;SH3KBP1;ARPC1B;CLTC;CLTB;CLTA;AP2A1;ARRB2;CAPZB;CHMP1A;CCR5;RAB8A;ACTR3;ACTR2;ARAP2;EPS15L1;ARAP1;VPS37B;RHOA;EPN1;ARFGAP2;DNM2;TGFBR2;RABEP1;ARF5;ARF6;RAB7A;CHMP5;VPS4B;PARD6G;ASAP1;IL2RG;CDC42;CYTH4;AP2S1;MVB12A;LDLR;GIT2;GBF1;PML;RAB11B;RAB10;ITCH;CAPZA1;CAPZA2;IL2RB;SPG21 Yersinia infection 65/137 0 0 0 0 3.5303 96.0164 GSK3B;WIPF1;WIPF2;ARPC1B;ARPC5L;PIK3CD;ACTB;ACTG1;CRKL;PYCARD;RPS6KA3;TBK1;AKT2;RPS6KA1;CASP1;RAC2;IKBKG;RAC1;MAP2K3;ACTR3;ACTR2;MAP2K1;MAP2K2;ARHGEF12;CHUK;ITGA4;RHOG;IRAK4;RHOA;VAV1;ZAP70;CD8B;IRF3;CD8A;LCK;ARHGEF1;LCP2;ARHGEF7;ARF6;ROCK1;PXN;WAS;PIK3R3;CDC42;MAPK9;PIP5K1A;MAPK1;PTK2B;MAP2K7;WASF2;MAP2K6;MAPK3;GIT2;FYB1;LIMK1;NFATC3;NFATC2;ARPC4;ARPC5;MAPK11;ARPC2;ARPC3;TAB1;LAT;MYD88 Human immunodeficiency virus 1 infection 85/212 0 0 0 0 2.6211 61.9342 PIK3CD;CD3G;FASLG;CD3E;CD3D;CRKL;CASP9;TBK1;GNGT2;TRIM5;AP1G1;AKT2;CASP3;CFL1;RAC2;AP1S1;ELOB;ELOC;IKBKG;RAC1;CCR5;B2M;MAP2K3;MAP2K1;MAP2K2;CHUK;PRKCB;FBXW11;HLA-B;TAP2;HLA-C;TAP1;HLA-A;IRAK4;HLA-F;TNFRSF1B;HLA-G;HLA-E;RBX1;TAPBP;TNFRSF1A;IRF3;PXN;GNAI3;PIK3R3;RNF7;GNAI2;MAPK9;GNG10;NRAS;GNG2;GNG5;PLCG2;MAPK1;PTK2B;FADD;BAK1;BID;MAP2K7;PAK2;AP1M1;MAP2K6;MAPK3;APOBEC3C;APOBEC3D;APOBEC3F;APOBEC3G;APOBEC3H;BAD;LIMK1;NFATC3;NFATC2;BST2;MAPK11;GNB2;GNB1;RPS6KB2;BAX;CALM3;KRAS;TAB1;CD247;MYD88;BCL2L1;CUL4B Influenza A 72/172 0 0 0 0 2.8155 63.5219 CIITA;CALCOCO2;PIK3CD;ADAR;FASLG;NXT2;ACTB;ACTG1;PYCARD;CASP9;IFIH1;CCND3;TBK1;AKT2;CASP3;KPNA6;TNFSF10;CASP1;TRIM25;IKBKG;HLA-DOA;KPNA2;JAK2;IKBKE;HLA-DPA1;JAK1;MAP2K1;MAP2K2;RSAD2;CHUK;PRKCB;DDX58;IRAK4;TYK2;TNFRSF1A;DNAJC3;IFNG;IRF3;OAS1;OAS2;TRAF3;IRF7;VDAC1;SLC25A5;IRF9;HLA-DQB1;SLC25A6;NLRX1;PIK3R3;HLA-DMA;HLA-DMB;PABPN1;CCL5;MAPK1;FADD;BAK1;BID;RAE1;MAPK3;FDPS;HLA-DRB5;STAT1;EIF2AK2;PML;RAB11B;MAVS;HLA-DPB1;HLA-DRA;BAX;HLA-DRB1;MYD88;NFKBIB Autophagy 59/137 0 0 0 0 2.9524 59.2878 MTMR14;WDR41;PIK3CD;HMGB1;TBK1;AKT2;RB1CC1;LAMP2;MLST8;CTSD;SNAP29;RAB8A;SH3GLB1;GABARAPL2;GABARAPL1;MAP2K1;MAP2K2;DAPK2;ATG9A;DAPK3;RRAS2;WIPI1;WIPI2;ATG13;ATG12;VAMP8;RRAGC;AKT1S1;ATG4B;ATG4A;ATG4D;RAB7A;BECN1;RAB1A;PIK3R3;HIF1A;TANK;GABARAP;PPP2CA;MAPK9;NRAS;ATG101;TP53INP2;MAPK1;NRBF2;ATG7;ATG5;MAPK3;IGBP1;BAD;EIF2AK3;EIF2AK4;CFLAR;ATG16L1;RHEB;RPS6KB2;ATG2A;KRAS;BCL2L1 Protein processing in endoplasmic reticulum 69/171 0 0 0 0 2.6429 52.3579 UBXN1;PRKCSH;UBE2D2;UBE2D3;UBE2D1;HERPUD1;MAN1A2;SEC61G;CAPN2;UFD1;FBXO6;MAN1A1;CAPN1;SEC61B;UBXN4;SIL1;UBXN6;SEC13;SSR4;SSR2;SSR3;DNAJB12;YOD1;PDIA6;RAD23B;DDOST;RBX1;DNAJC3;DNAJC1;SELENOS;DDIT3;DNAJC5;DNAJB11;ERP29;PLAA;PREB;ATF4;VCP;SAR1A;ATF6B;SAR1B;DERL1;DERL2;RRBP1;UBE2J2;RNF5;UBE2J1;ERLEC1;LMAN1;MAPK9;BAG2;OS9;LMAN2;BAG1;SSR1;BAK1;MAP2K7;SEC23B;XBP1;SEC24A;EIF2AK1;EDEM2;EIF2AK3;EIF2AK2;UBE2G1;EIF2AK4;DNAJA2;BAX;P4HB T cell receptor signaling pathway 48/104 0 0 0 0 3.3412 64.7025 GSK3B;ITK;PIK3R3;PIK3CD;CBLB;CD3G;CD3E;RASGRP1;CD3D;CDC42;MAPK9;NRAS;AKT2;GRAP2;CTLA4;MAPK1;MAP3K8;FYN;IKBKG;MAP2K7;PAK2;NCK1;MAPK3;MAP2K1;MAP2K2;CHUK;NFATC3;NFATC2;RHOA;VAV1;ZAP70;MAPK11;PTPRC;CD8B;IFNG;CD8A;LCK;GRB2;LCP2;KRAS;PTPN6;CD247;PDCD1;NFKBIE;MAP3K14;CARD11;LAT;NFKBIB Shigellosis 90/246 0 0 0 0 2.258 43.6964 GSK3B;ARF1;GSK3A;CALCOCO2;ARPC1B;UBE2D2;UBE2D3;ARPC5L;UBE2D1;ILK;PIK3CD;ACTB;CRKL;ACTG1;HK1;PYCARD;TBK1;CAPNS1;AKT2;CASP4;CAPN2;CASP1;IKBKG;RAC1;CAPN1;ACTR3;GABARAPL2;ACTR2;GABARAPL1;CHUK;FBXW11;WIPI1;ACTN4;WIPI2;ATG12;RHOA;RBX1;TNFRSF1A;MYL5;RRAGC;IRF3;AKT1S1;UBE2V2;HCLS1;VDAC1;RBCK1;UBE2V1;PFN1;TLN1;PPID;ARF6;RNF31;BECN1;ROCK1;PXN;PIK3R3;U2AF1;GABARAP;MYL12A;FOXO1;MYL12B;U2AF1L4;CDC42;MAPK9;CYTH4;UBB;CCL5;PLCG2;MAPK1;WASF2;ATG5;MAPK3;CBX3;GLMN;ARPC4;ARPC5;DIAPH1;MAPK11;ARPC2;TNIP1;ARPC3;ATG16L1;RPS6KB2;MDM2;UBE2N;BAX;TAB1;MYD88;BCL2L1;NFKBIB 1–20 of 314 itemsof 16 pagesDownloading entire data
You must use "Save as" or "Save link as" from the context menu (by right-clicking the button) to download the entire data.
Cluster: c7
Markers
| 0 | 1.5873 | 0.945 | 0.97 | 0 | c7 | MT-ND4 |
| 0 | 1.7022 | 0.946 | 0.969 | 0 | c7 | MT-ND2 |
| 0 | 1.6176 | 0.974 | 0.992 | 0 | c7 | MT-ND5 |
| 0 | 1.738 | 0.823 | 0.841 | 0 | c7 | MT-ND6 |
| 0 | 2.1927 | 0.995 | 0.981 | 0 | c7 | MALAT1 |
| 0 | 1.6673 | 0.983 | 0.993 | 0 | c7 | MT-ND1 |
| 0 | 1.6347 | 0.988 | 0.996 | 0 | c7 | MT-ATP8 |
| 0 | 1.8512 | 0.987 | 0.995 | 0 | c7 | MT-ND3 |
| 0 | 1.4428 | 0.993 | 0.999 | 0 | c7 | MT-CO2 |
| 0 | 1.5923 | 0.991 | 0.997 | 0 | c7 | MT-ATP6 |
| 0 | 1.4703 | 0.993 | 0.999 | 0 | c7 | MT-CO3 |
| 0 | 1.632 | 0.992 | 0.998 | 0 | c7 | MT-ND4L |
| 0 | 1.6954 | 0.992 | 0.998 | 0 | c7 | MT-CYB |
| 0 | 1.5604 | 0.995 | 0.999 | 0 | c7 | MT-CO1 |
| 6.623e-131 | 1.5978 | 0.677 | 0.801 | 2.221e-126 | c7 | FUS |
| 5.408e-107 | 2.4171 | 0.57 | 0.552 | 1.814e-102 | c7 | NEAT1 |
| 5.51e-107 | 0.1072 | 0.179 | 0.546 | 1.848e-102 | c7 | LSM8 |
| 6.321e-106 | 0.1291 | 0.152 | 0.489 | 2.12e-101 | c7 | BCAS2 |
| 6.257e-105 | 0.1178 | 0.147 | 0.481 | 2.098e-100 | c7 | RGS14 |
| 5.896e-104 | 0.2521 | 0.168 | 0.519 | 1.977e-99 | c7 | HAX1 |
Downloading entire data
You must use "Save as" or "Save link as" from the context menu (by right-clicking the button) to download the entire data.
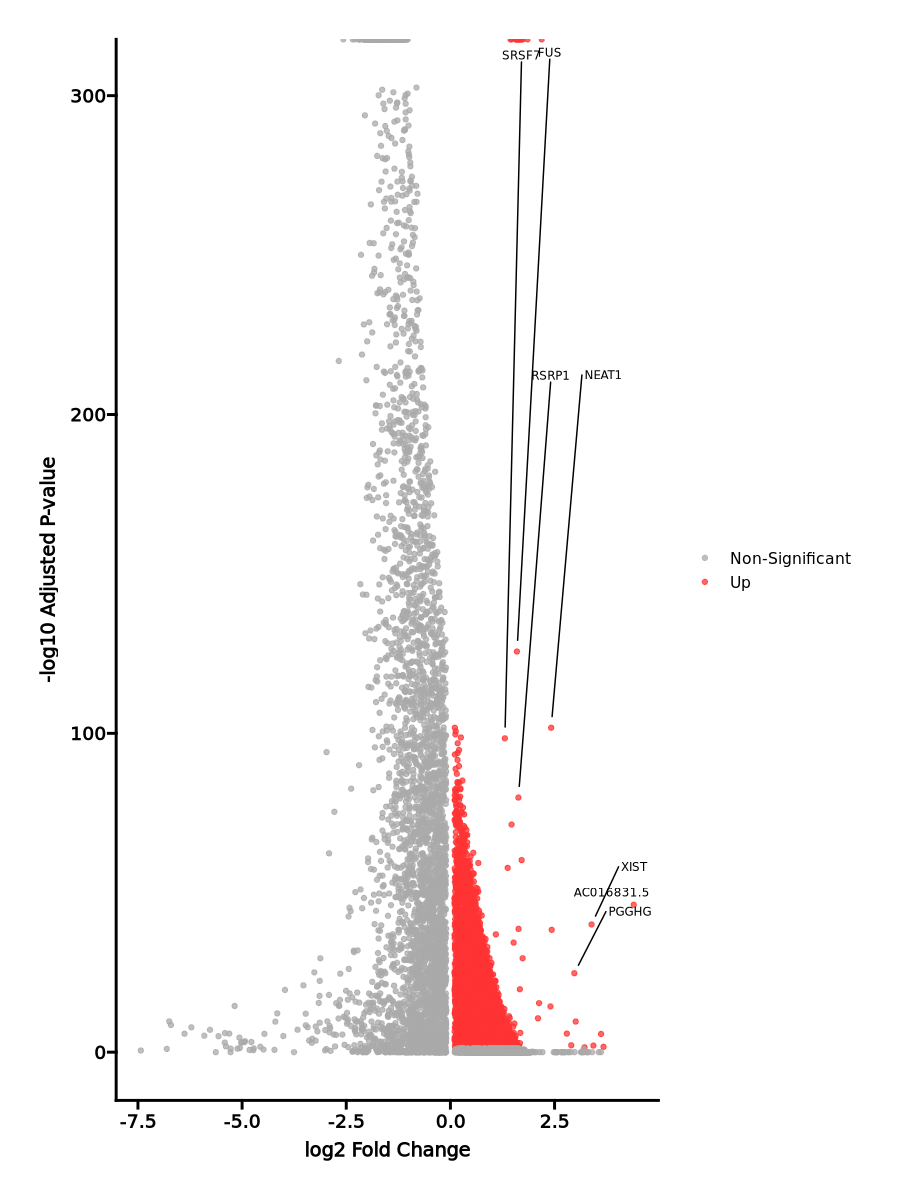
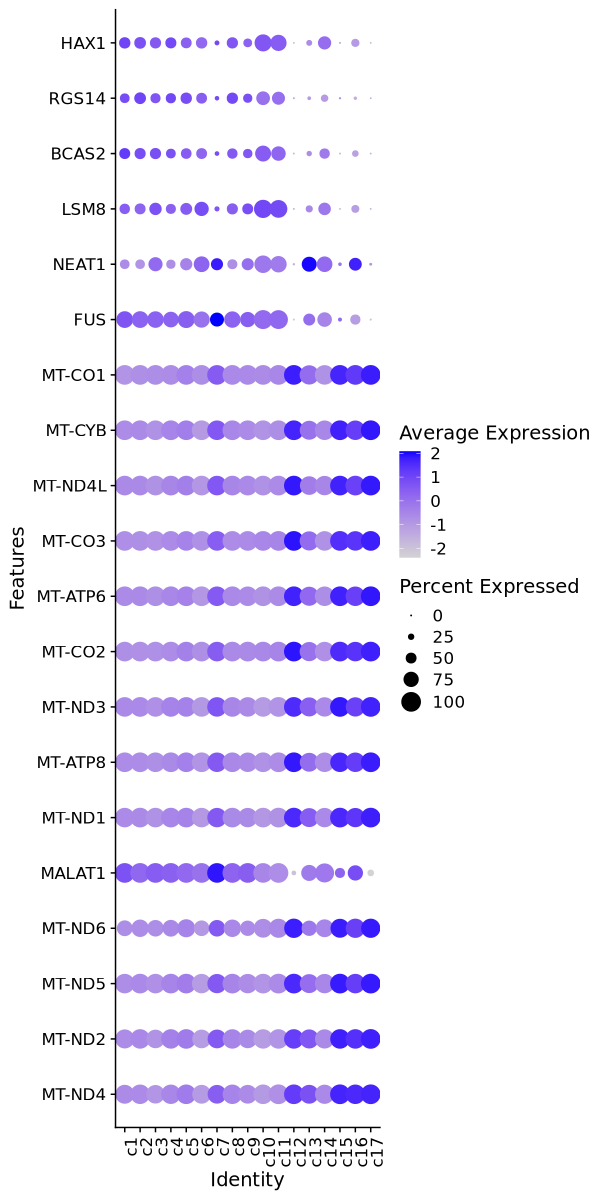
Enrichment Analysis
- The enrichment analysis results of the top biological pathways associated with the input gene set. Each bar represents a pathway, with the length of the bar indicating the number of input genes overlapping with genes in that pathway. The color intensity of the bars reflects the statistical significance of the enrichment (p-value).Image loading error!
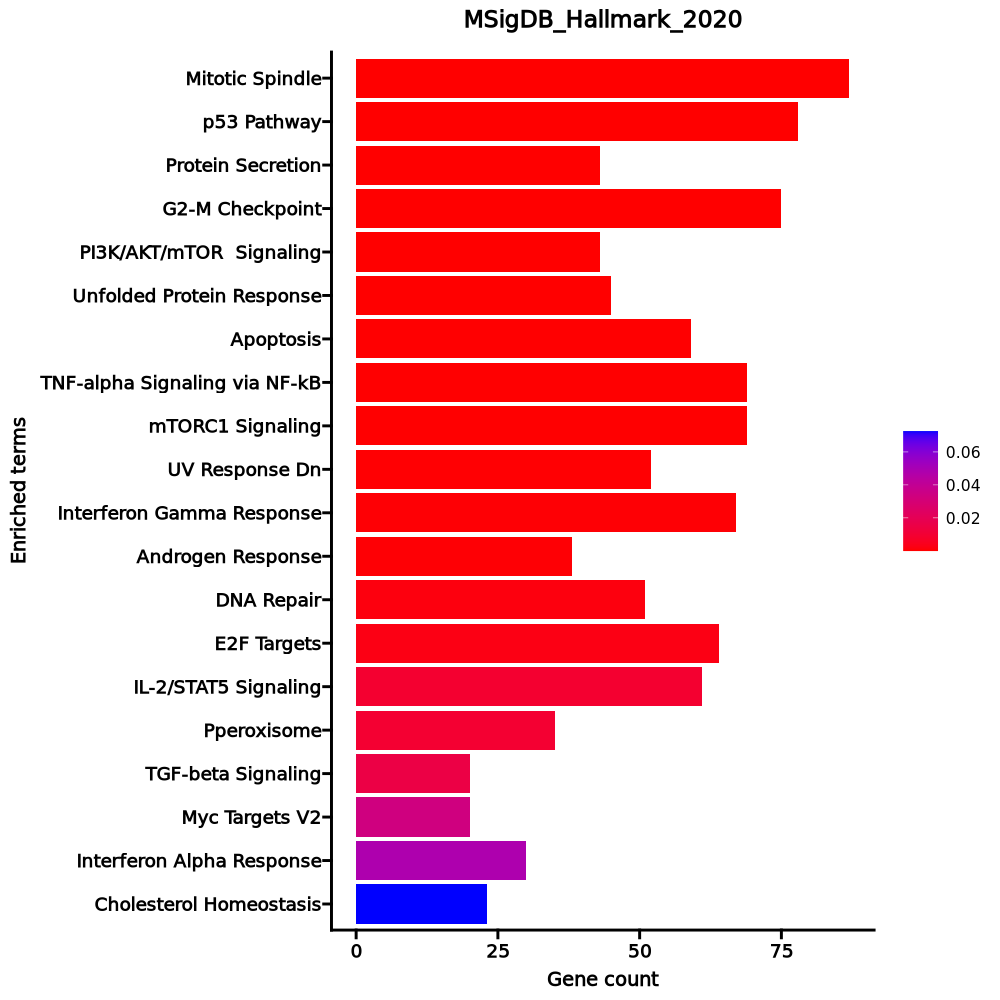
Mitotic Spindle 87/199 0 0 0 0 2.6081 60.0943 CEP57;NUMA1;WASL;BRCA2;ARHGAP5;SMC4;PREX1;PCM1;CNTRL;NCK2;ARFIP2;CEP250;TLK1;KIFAP3;SPTAN1;CDK5RAP2;PLEKHG2;RFC1;CSNK1D;ACTN4;KIF22;SMC1A;DYNLL2;CKAP5;TUBA4A;CD2AP;LATS1;TIAM1;ARHGAP10;CLIP1;ALS2;RASA1;RASA2;ARHGEF3;MYH9;ATG4B;ARHGEF2;KIF20B;EZR;KPTN;ARHGEF7;SOS1;DOCK2;RAPGEF6;ARL8A;PAFAH1B1;NOTCH2;ROCK1;EPB41;TUBGCP2;PXN;TUBD1;NEDD9;KLC1;ABR;RHOT2;BCL2L11;KIF3B;EPB41L2;STK38L;CEP72;FLNA;CEP192;PCNT;MARK4;PDLIM5;SPTBN1;ARFGEF1;DYNC1H1;TBCD;RANBP9;ARHGAP27;HOOK3;SSH2;LRPPRC;NET1;CENPE;NIN;APC;PRC1;CENPJ;ABI1;NF1;TUBGCP5;TUBGCP3;RAB3GAP1;MAP3K11 p53 Pathway 78/200 0 0 0 0 2.141 31.8504 CYFIP2;RB1;APP;CCNK;BTG2;CD81;CCP110;ABAT;RRP8;PITPNC1;PIDD1;SEC61A1;SESN1;FDXR;KIF13B;CTSF;UPP1;IER5;CTSD;POLH;TSC22D1;PRMT2;APAF1;FBXW7;SPHK1;F2R;RHBDF2;AEN;CGRRF1;PRKAB1;DDB2;WRAP73;RAP2B;RAD51C;TRAF4;DDIT3;DDIT4;ANKRA2;TP53;ATF3;PPP1R15A;POM121;HDAC3;SLC35D1;RETSAT;PVT1;RGS16;NOL8;XPC;FOXO3;PPM1D;RCHY1;NDRG1;TOB1;CDKN2AIP;IRAK1;RAB40C;ZMAT3;MKNK2;RALGDS;IP6K2;PLK3;JUN;PMM1;GADD45A;ZBTB16;WWP1;DEF6;PTPRE;SP1;MDM2;FAS;ERCC5;COQ8A;MXD1;ADA;MXD4;RAD9A Protein Secretion 43/96 0 0 0 0 2.7084 35.1352 COPB2;STX12;SGMS1;COPB1;GOSR2;CLTC;USO1;ICA1;ATP1A1;CLCN3;NAPG;RPS6KA3;LMAN1;GOLGA4;AP1G1;LAMP2;ATP6V1H;MAPK1;ATP7A;DNM1L;YKT6;SEC31A;ARFGEF1;ARFGEF2;STX7;GBF1;COG2;ADAM10;AP3B1;AP2B1;STAM;SCAMP1;IGF2R;ARCN1;GALC;GNAS;YIPF6;VPS45;SEC22B;SEC24D;PAM;GLA;BET1 G2-M Checkpoint 75/200 0 0 0 0 2.0076 25.3498 CDKN1B;CCNT1;NUMA1;AMD1;HNRNPU;ARID4A;BRCA2;SMC4;XPO1;KMT5A;LBR;UPF1;SS18;PRMT5;TLE3;SMARCC1;SLC38A1;RBM14;ATRX;LIG3;PRPF4B;KIF22;SMC1A;SLC7A5;ILF3;SFPQ;DDX39A;DBF4;RBL1;EWSR1;NUP50;MTF2;NUP98;MCM6;KIF20B;KPNB1;PAFAH1B1;NOTCH2;PRIM2;CUL5;YTHDC1;CUL3;SRSF1;CUL1;PDS5B;HIF1A;SLC7A1;GSPT1;PURA;WRN;TRA2B;NSD2;E2F3;E2F4;CASP8AP2;STIL;SMAD3;ODF2;CDC7;FANCC;FOXN3;MAPK14;PML;CUL4A;SQLE;CENPE;STAG1;POLA2;NASP;UBE2S;PRC1;HNRNPD;TACC3;MNAT1;EZH2 PI3K/AKT/mTOR Signaling 43/105 0 0.0004 0 0 2.3139 23.6904 GSK3B;CDKN1B;MAPKAP1;CLTC;PTEN;SLC2A1;SLA;PIK3R3;ITPR2;DAPP1;CXCR4;RPTOR;RPS6KA3;MAPK9;MAPK8;TBK1;GRK2;PPP2R1B;PRKAR2A;MKNK1;MKNK2;AKT1;THEM4;MAPK1;RIPK1;PLCG1;MAP3K7;PDK1;MAP2K6;PAK4;SMAD2;VAV3;ACTR2;PLA2G12A;PRKCB;TRAF2;IRAK4;TIAM1;DDIT3;CAMK4;RAF1;SQSTM1;NFKBIB Unfolded Protein Response 45/113 0.0001 0.0005 0 0 2.208 21.6953 EIF4A2;ERO1A;EIF4A1;GOSR2;PARN;CXXC1;SLC1A4;EDC4;TATDN2;EXOSC10;KHSRP;MTREX;EXOSC2;EXOSC1;SEC31A;HSPA9;NOP56;ZBTB17;TTC37;NFYA;FUS;SLC30A5;EDEM1;EIF2AK3;DDX10;ASNS;WIPI1;ARFGAP1;CNOT4;DNAJC3;SLC7A5;CNOT6;TUBB2A;XPOT;CNOT2;DDIT4;SRPRA;PREB;HYOU1;DCP1A;ATF6;ATF3;DCP2;EXOC2;ATF4 Apoptosis 59/161 0.0001 0.0005 0 0 1.9315 18.3513 APP;BTG2;CDKN1B;BRCA1;ENO2;CASP9;CASP8;FDXR;CD38;CASP2;DNM1L;SPTAN1;ANXA1;IFNGR1;F2R;PPP2R5B;RHOB;DNAJC3;TGFBR3;DDIT3;IRF1;MADD;DPYD;ETF1;SQSTM1;ATF3;BIRC3;RNASEL;RETSAT;ROCK1;SATB1;SLC20A1;PSEN2;XIAP;NEDD9;PSEN1;ADD1;RHOT2;PAK1;BCL2L11;ANKH;LMNA;SC5D;BMF;JUN;CREBBP;GADD45B;GCH1;GADD45A;MGMT;GSR;CFLAR;SOD2;IGF2R;SMAD7;CYLD;FAS;CTNNB1;CD69 TNF-alpha Signaling via NF-kB 69/200 0.0002 0.0009 0 0 1.7593 15.2871 BTG2;CD83;B4GALT1;TNFAIP3;IRS2;IFIT2;PANX1;ZFP36;ZC3H12A;NAMPT;SLC16A6;MAP3K8;CCNL1;IER5;IER2;KDM6B;TSC22D1;DDX58;SPHK1;TRAF1;GEM;RHOB;TUBB2A;IRF1;SIK1;SGK1;SQSTM1;ATF3;BIRC2;BIRC3;PPP1R15A;PFKFB3;SDC4;TANK;RELB;NFIL3;DNAJB4;PDLIM5;LDLR;STAT5A;EGR1;JUN;EGR2;SMAD3;GADD45B;GCH1;GADD45A;TIPARP;CCL20;TNFRSF9;CFLAR;ATP2B1;SOD2;NFKB1;FOSL2;NFKB2;EHD1;NFKBIA;NR4A1;PTPRE;KLF6;ID2;GPR183;BHLHE40;KLF9;CD69;IL7R;MXD1;NFE2L2 mTORC1 Signaling 69/200 0.0002 0.0009 0 0 1.7593 15.2871 ERO1A;GSK3B;BTG2;TFRC;PITPNB;SLC2A1;SLA;ATP2A2;TM7SF2;FADS2;TBK1;NAMPT;FDXR;SLC37A4;PDK1;ACTR2;STARD4;HMGCS1;ELOVL5;IFRD1;ELOVL6;ACSL3;TUBA4A;SYTL2;SLC7A5;DDX39A;DDIT3;DDIT4;MTHFD2L;ETF1;SQSTM1;PPP1R15A;IDI1;RAB1A;NUP205;USO1;PIK3R3;CXCR4;DAPP1;SLC1A4;HMGCR;ADD3;ADIPOR2;GGA2;NFIL3;RDH11;SC5D;YKT6;LDLR;HSPA9;GOT1;HSPA4;SRD5A1;EDEM1;IDH1;GSR;CYP51A1;ASNS;IMMT;GTF2H1;MLLT11;SQLE;GCLC;PFKL;P4HA1;BHLHE40;NMT1;GLA;NFKBIB UV Response Dn 52/144 0.0003 0.0015 0 0 1.8857 15.3366 PHF3;CDKN1B;CELF2;PTEN;ICA1;PIK3CD;PRDM2;NR3C1;SYNE1;NIPBL;SIPA1L1;ZMIZ1;SLC22A18;PIAS3;MIOS;SFMBT1;BCKDHB;ATRX;DYRK1A;RUNX1;TGFBR2;TGFBR3;RASA2;NOTCH2;YTHDC1;GCNT1;MRPS31;PIK3R3;ADD3;ATP2C1;SLC7A1;SCAF8;ATXN1;MTA1;GRK5;TOGARAM1;FYN;PDLIM5;LDLR;MAP2K5;SMAD3;MGMT;NEK7;NR1D2;SYNJ2;ATP2B1;MAPK14;NFKB1;PEX14;SMAD7;BHLHE40;CDK13 Interferon Gamma Response 67/200 0.0005 0.0024 0 0 1.6817 12.6868 OGFR;SAMD9L;EIF4E3;SPPL2A;TNFAIP3;ADAR;IFIT2;CASP8;NAMPT;DHX58;TRIM25;CD38;ITGB7;UPP1;JAK2;CMTR1;HERC6;ZBP1;IFNAR2;IL4R;SP110;IL15;DDX58;NCOA3;ARID5B;TAPBP;IRF4;IRF1;OAS3;PELI1;IRF7;TRIM14;IRF5;RAPGEF6;IRF9;MVP;DDX60;SAMHD1;HIF1A;RNF213;KLRK1;APOL6;ST8SIA4;ST3GAL5;RIPK1;PTPN1;PNPT1;GCH1;AUTS2;IL10RA;MX2;MX1;EIF2AK2;IFI44;PARP14;TOR1B;SOD2;PARP12;NFKB1;PML;NFKBIA;ZNFX1;FAS;CD69;XAF1;PTPN2;PFKP Androgen Response 38/100 0.0006 0.0025 0 0 2.0426 15.167 IDI1;SLC26A2;B4GALT1;ABHD2;SRF;NGLY1;STK39;HMGCR;IQGAP2;NDRG1;CDC14B;UBE2J1;CAMKK2;ELK4;RPS6KA3;LMAN1;ANKH;ZMIZ1;PGM3;AKT1;PTK2B;PDLIM5;SLC38A2;HMGCS1;TSC22D1;ELOVL5;ACTN1;GSR;ARID5B;ACSL3;ELL2;PIAS1;CDK6;APPBP2;GPD1L;SGK1;SEC24D;FKBP5 DNA Repair 51/150 0.0016 0.0062 0 0 1.7175 11.057 ELL;SEC61A1;REV3L;NELFB;POLL;TK2;NELFCD;POLH;RFC5;RFC3;RFC4;LIG1;NCBP2;NME3;VPS37B;DDB2;NT5C3A;DDB1;RRM2B;NFX1;POLR1C;HCLS1;SRSF6;TP53;VPS28;POM121;GTF3C5;RNMT;CSTF3;USP11;DCTN4;XPC;AAAS;NT5C;POLR2A;POLD1;RAE1;TAF13;UPF3B;GTF2H1;SUPT5H;GTF2H3;SMAD5;TARBP2;POLA2;ERCC3;POLR3C;ERCC2;ERCC8;ERCC5;ADA E2F Targets 64/200 0.0025 0.009 0 0 1.5696 9.3944 NUP107;CDKN1B;MRE11;TFRC;MCM7;CSE1L;CCP110;BUB1B;SMC6;BRCA1;BRCA2;SMC4;IPO7;XPO1;ING3;CHEK2;LBR;HELLS;RFC3;LIG1;RFC1;EED;CTPS1;KIF22;SMC1A;MMS22L;ILF3;DDX39A;RAD51C;TIMELESS;MCM6;TP53;PRIM2;NUP205;DNMT1;PRKDC;SRSF1;PDS5B;PPM1D;GSPT1;TBRG4;POLD1;TRA2B;EXOSC8;ORC2;NOP56;CBX5;SPAG5;GINS4;ATAD2;DONSON;NUP153;MLH1;CENPE;POLA2;STAG1;RAD50;NASP;UBE2S;BRMS1L;HNRNPD;TACC3;CNOT9;EZH2 IL-2/STAT5 Signaling 61/199 0.0088 0.0294 0 0 1.4732 6.9702 CYFIP1;CD83;CD81;AHR;ITGAE;IKZF2;LCLAT1;CTLA4;MAP3K8;SLC39A8;TNFRSF4;GABARAPL1;PRKCH;IL4R;IFNGR1;NCOA3;PUS1;TNFRSF18;TRAF1;FAM126B;TNFRSF1B;CKAP4;RHOB;TIAM1;TWSG1;IRF4;MAPKAPK2;PLEC;ABCB1;RGS16;NOP2;FURIN;NDRG1;SOCS2;NT5E;NFIL3;PLAGL1;LRRC8C;LRIG1;SNX9;ICOS;RABGAP1L;POU2F1;GADD45B;IL10RA;TNFRSF9;HUWE1;IGF2R;BATF;TTC39B;KLF6;P2RX4;MYO1C;P4HA1;SNX14;IL2RA;BHLHE40;BCL2;GALM;MXD1;IL18R1 Pperoxisome 35/104 0.0095 0.0296 0 0 1.6886 7.8678 IDI1;ABCD2;ABCB1;ABCD3;RETSAT;CTBP1;MVP;ECI2;HSD17B4;IDE;CLN8;CLN6;HMGCL;ATXN1;RDH11;NUDT19;LONP2;MLYCD;ACAA1;ABCD1;SMARCC1;ACSL1;ELOVL5;IDH1;EPHX2;ACSL5;ACSL4;CTPS1;SOD2;PEX13;PEX14;GNPAT;ERCC3;ACOX1;PEX6 TGF-beta Signaling 20/54 0.015 0.0441 0 0 1.9563 8.2162 PPP1R15A;SMAD3;SMURF2;SLC20A1;XIAP;ARID4B;FURIN;THBS1;TGFBR1;SMAD7;NCOR2;CDK9;PPM1A;FNTA;APC;ID2;CTNNB1;MAP3K7;SKIL;SPTBN1 Myc Targets V2 20/58 0.0332 0.0922 0 0 1.7499 5.959 NOP56;DDX18;PUS1;PRMT3;NOP2;PPAN;WDR74;PPRC1;WDR43;GNL3;TBRG4;SUPV3L1;RCL1;TCOF1;MYBBP1A;LAS1L;MPHOSPH10;UTP20;MAP3K6;SLC19A1 Interferon Alpha Response 30/97 0.048 0.1263 0 0 1.4892 4.5227 OGFR;SAMD9L;SAMD9;ADAR;DDX60;IFIT2;NUB1;CASP8;TRIM5;DHX58;TRIM25;CMTR1;HERC6;IL4R;PNPT1;SP110;IL15;MX1;IFI44;EIF2AK2;PARP14;PARP9;PARP12;MOV10;IRF1;IRF7;TRIM14;NCOA7;CD47;IRF9 Cholesterol Homeostasis 23/74 0.0725 0.1813 0 0 1.4992 3.9335 IDI1;STARD4;PCYT2;HMGCS1;CYP51A1;HMGCR;ANTXR2;HSD17B7;SREBF2;TM7SF2;FADS2;SQLE;ATXN2;NFIL3;FASN;TP53INP1;PDK3;SC5D;CTNNB1;MVD;GUSB;LDLR;ATF3 1–20 of 50 itemsof 3 pagesDownloading entire data
You must use "Save as" or "Save link as" from the context menu (by right-clicking the button) to download the entire data.
- The enrichment analysis results of the top biological pathways associated with the input gene set. Each bar represents a pathway, with the length of the bar indicating the number of input genes overlapping with genes in that pathway. The color intensity of the bars reflects the statistical significance of the enrichment (p-value).Image loading error!
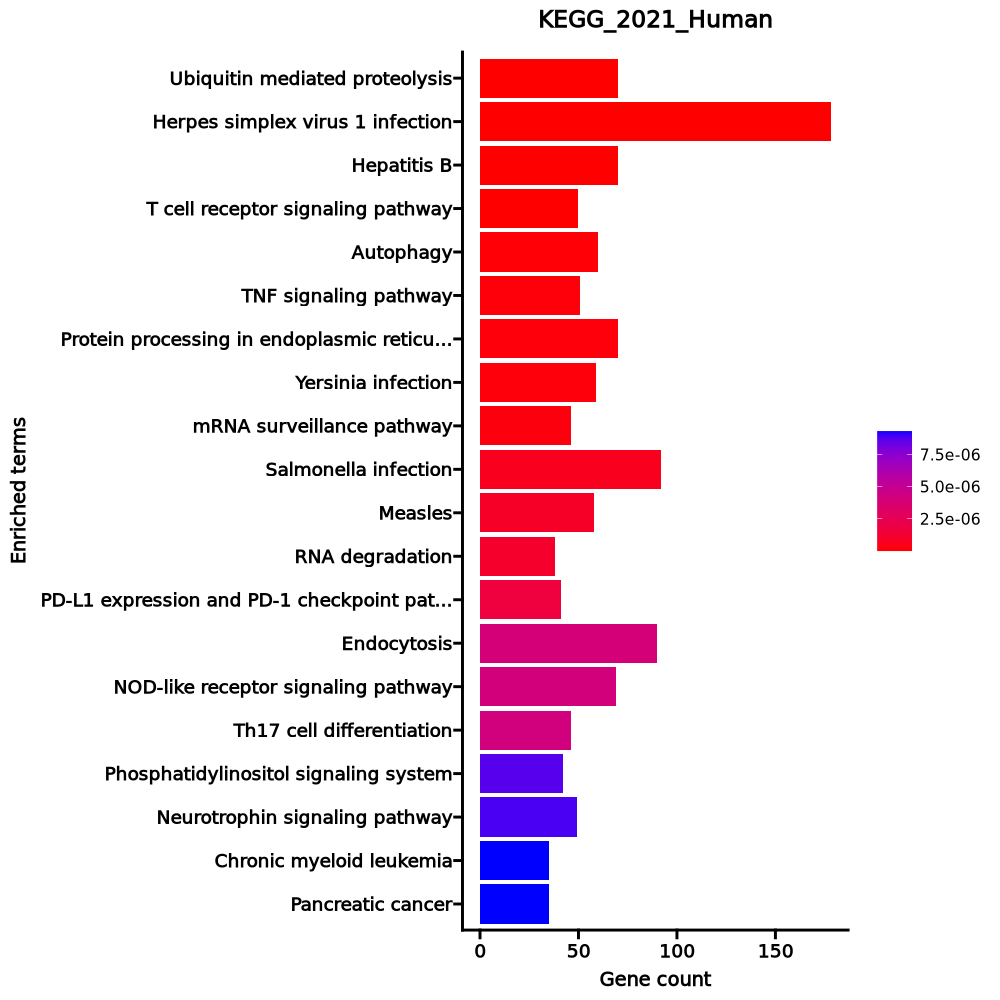
Ubiquitin mediated proteolysis 70/140 0 0 0 0 3.3543 88.3941 UBE3C;UBE3A;UBE3B;BRCA1;UBE2Z;HERC4;HERC2;FBXO4;BTRC;SKP2;PIAS3;ANAPC7;FBXW8;FBXW11;FBXW7;UBE4A;UBE4B;PIAS1;DDB2;DDB1;CDC34;UBE2R2;TRAF6;ANAPC4;ANAPC5;BIRC6;ANAPC1;BIRC2;ANAPC2;BIRC3;CUL5;UBA6;MGRN1;CUL3;CUL2;CUL1;XIAP;CBL;RCHY1;UBE2J1;COP1;FZR1;VHL;UBE2H;MAP3K1;PPIL2;SMURF2;UBE2B;FANCL;HUWE1;SYVN1;WWP1;WWP2;UBE2G2;PML;CUL4A;KLHL9;UBE2W;ITCH;UBE2S;NEDD4;CDC16;MDM2;UBA3;UBE2O;ERCC8;UBA1;TRIM37;TRIP12;CUL4B Herpes simplex virus 1 infection 178/498 0 0 0 0 1.8799 43.4767 ZNF331;ZNF571;ZNF570;PPP1CB;TBK1;ZFP30;AKT2;ZNF605;ZNF84;ZNF846;ZNF85;ZNF845;AKT1;ZNF569;ZNF568;ZNF689;ZNF567;ZNF721;ZNF324;ZNF566;MAP3K7;ZNF200;ZNF684;ZNF17;IFNAR2;ZNF441;ZNF562;ZNF561;ZNF680;ZNF160;ZNF12;HCFC2;HCFC1;ZNF91;ZNF718;ZNF836;ZNF317;SRSF4;ZNF557;SRSF6;SRSF7;ZNF675;TP53;ZNF432;ZNF398;ZNF430;ZNF551;ZNF550;ZNF671;ZNF792;ZNF791;ZNF273;PIK3R3;PIK3R1;ZNF26;ZNF708;IRAK1;ZNF549;ZNF548;ZNF426;TNFRSF14;ZNF700;ZNF302;ZNF544;ZNF786;ZNF268;ZNF267;ZNF420;EIF2B5;EIF2B4;EIF2B3;ZNF141;ZNF383;POU2F1;ZNF140;EIF2AK3;EIF2AK2;EIF2AK4;POU2F2;NFKB1;SRPK1;NFKBIA;MAVS;ZNF37A;ZNF814;BCL2;TAB2;TAB1;ZNF136;ZNF257;ZNF256;ZNF530;ZNF254;ZNF253;ZNF490;ZNF43;PIK3CD;CGAS;ZNF44;ZFP82;IKBKB;CASP9;ZNF808;CASP8;ZNF41;ZNF527;ZNF765;JAK2;ZNF764;IKBKE;ZNF124;ZNF641;JAK1;ZIK1;ZNF486;ZNF761;ZNF484;APAF1;CHUK;IFNGR1;DDX58;TRAF2;IRAK4;ZFP90;TAPBP;IRF3;TRAF3;TRAF6;OAS3;TRAF5;IRF7;ITGA5;ZNF234;ZNF597;BIRC2;IRF9;BIRC3;ZNF595;ZNF473;RNASEL;ZNF230;SP100;ZNF195;SRSF1;ZNF3;ZNF7;ZNF506;ZNF627;ZNF746;ZNF107;ZNF227;ZNF623;ZNF226;ZNF621;ZNF585B;ZNF101;ZNF286A;ZNF100;ZNF583;ZNF461;ZNF460;ZNF182;ZNF181;ZNF180;ZNF77;ZNF79;PML;ZNF33B;ZNF33A;ZNF737;ZNF615;ZNF736;ZNF614;FAS;ZNF699;ZNF611;ZNF333;ZNF211 Hepatitis B 70/162 0 0 0 0 2.5485 46.5669 RB1;ATF2;PIK3CD;CASP9;IKBKB;TBK1;CASP8;CREB3L4;AKT2;CREB3L2;AKT1;EP300;JAK2;MAP3K7;IKBKE;JAK1;MAP2K4;APAF1;CHUK;PRKCB;DDX58;IRAK4;TGFBR1;DDB2;TGFBR2;DDB1;CREB1;CCNE2;IRF3;TRAF3;TRAF6;IRF7;RAF1;SOS1;TP53;SOS2;ATF4;ATF6B;PIK3R3;PIK3R1;MAPK9;MAPK8;IRAK1;MAPK1;PTK2B;E2F3;STAT6;MAP2K7;MAP2K6;MAPK3;STAT5A;CREBBP;EGR2;JUN;SMAD4;SMAD3;MAP3K1;NFATC3;NFATC2;BRAF;NFATC1;MAPK14;NFKB1;MAPK13;NFKBIA;MAVS;BCL2;FAS;TAB2;TAB1 T cell receptor signaling pathway 50/104 0 0 0 0 3.0955 54.565 GSK3B;PIK3CD;IKBKB;PPP3CA;PPP3CB;PPP3CC;AKT2;GRAP2;NCK2;AKT1;CTLA4;MAP3K8;MAP3K7;VAV3;CHUK;PDPK1;VAV1;ZAP70;PRKCQ;RAF1;SOS1;SOS2;CARD11;PIK3R3;PIK3R1;RASGRP1;MALT1;MAPK9;MAPK8;PAK1;MAPK1;FYN;PLCG1;ICOS;MAP2K7;MAPK3;PAK4;JUN;NFATC3;NFATC2;NFATC1;MAPK14;IL2;NFKB1;MAPK13;NFKBIA;CD4;CD28;MAP3K14;NFKBIB Autophagy 60/137 0 0 0 0 2.6068 42.9557 PTEN;PIK3CD;IRS2;ZFYVE1;RPTOR;TBK1;AKT2;RB1CC1;LAMP2;MLST8;AKT1;SUPT20H;MAP3K7;CTSD;GABARAPL1;PDPK1;DAPK2;ATG10;WIPI1;ATG14;ATG13;ATG12;RAB33B;RRAGB;TRAF6;DDIT4;ATG4B;PRKCQ;PIK3C3;SMCR8;RAF1;SQSTM1;ATG4D;RAB1A;PRKAA1;MTMR3;STX17;PIK3R4;PIK3R3;PIK3R1;AMBRA1;HIF1A;TANK;CAMKK2;MAPK9;PPP2CB;MAPK8;MAPK1;ATG7;MAPK3;UVRAG;EIF2AK3;EIF2AK4;CFLAR;VMP1;RPS6KB1;ATG16L1;RPS6KB2;ATG2A;BCL2 TNF signaling pathway 51/112 0 0 0 0 2.7944 43.9747 ATF2;PIK3CD;TNFAIP3;IKBKB;CASP8;CREB3L4;AKT2;CREB3L2;AKT1;MAP3K8;DNM1L;MAP3K7;MAP3K5;MAP2K4;CHUK;RIPK3;IL15;TRAF2;TRAF1;TNFRSF1B;CREB1;TRAF3;IRF1;TRAF5;BIRC2;ATF4;BIRC3;ATF6B;PIK3R3;PIK3R1;MAPK9;MAPK8;MAPK1;RIPK1;MAP2K7;MAP2K6;MAPK3;JUN;MLKL;CCL20;CFLAR;MAPK14;NFKB1;MAPK13;NFKBIA;ITCH;FAS;TAB2;TAB1;MAP3K14;IL18R1 Protein processing in endoplasmic reticulum 70/171 0 0 0 0 2.3201 36.3573 ERO1A;UBXN2A;NGLY1;SEC61A1;MAN1A2;UBXN8;MAN1A1;UBXN4;UBXN6;MAP3K5;SEC63;HSP90AA1;DNAJB12;MOGS;UBE4B;TRAF2;CKAP4;DNAJC3;DNAJC1;DDIT3;DNAJC5;PLAA;PREB;MAN1B1;ATF6;ATF4;PPP1R15A;VCP;SEC23A;ATF6B;SEL1L;CUL1;RRBP1;UBE2J1;DNAJB2;ATXN3;LMAN1;MAPK9;GANAB;MAPK8;HSPH1;OS9;UBQLN1;MAP2K7;SEC23B;SEC31B;SEC31A;UBQLN2;EDEM3;MBTPS1;SEC24B;SEC24A;EDEM1;AMFR;HSPA6;EIF2AK3;SYVN1;EIF2AK2;EIF2AK4;UBE2G2;DNAJC10;BCL2;STT3A;HYOU1;STT3B;SEC24D;SEC24C;HSPA1B;NFE2L2;HSPA1A Yersinia infection 59/137 0 0 0 0 2.5298 39.2515 GSK3B;WIPF1;WIPF2;PIK3CD;WASL;IKBKB;RPS6KA3;TBK1;AKT2;AKT1;MAP3K7;VAV3;MAP2K4;ACTR2;CHUK;ITGA4;TRAF2;IRAK4;VAV1;ZAP70;IRF3;TRAF6;ELMO1;ELMO2;ITGA5;ARHGEF7;CRK;ROCK1;ROCK2;PXN;PIK3R3;PIK3R1;ACTR3B;MAPK9;ACTR3C;MAPK8;IRAK1;PIP5K1A;MAPK1;PTK2B;PIP5K1C;PLCG1;MAP2K7;MAP2K6;MAPK3;GIT2;JUN;NFATC3;NFATC2;NFATC1;MAPK14;IL2;NFKB1;MAPK13;NFKBIA;CD4;TAB2;TAB1;PKN1 mRNA surveillance pathway 46/98 0 0 0 0 2.9552 45.6455 HBS1L;DAZAP1;RNMT;CSTF3;CSTF2;PPP2R2A;CASC3;MSI2;SMG7;GSPT2;GSPT1;SMG5;PPP1CB;PPP2CB;PPP2R1B;FIP1L1;PABPN1;PCF11;PPP2R5E;PPP2R3C;PAPOLG;SYMPK;PELO;UPF2;UPF1;CPSF7;CPSF6;RNGTT;CPSF1;NCBP1;FUS;NCBP2;CPSF3;PPP2R5B;UPF3B;UPF3A;PPP2R5C;SRRM1;WDR33;DDX19A;WDR82;PPP2R2B;PPP2R2D;ACIN1;ETF1;TARDBP Salmonella infection 92/249 0 0 0 0 1.9639 28.1965 CYFIP2;CYFIP1;CSE1L;FHOD1;PIK3CD;GCC2;WASL;PIK3C2A;FBXO22;PIK3CG;IKBKB;FYCO1;ACTR1B;TUBA1A;CASP8;AKT2;AKT1;MAP3K7;VPS39;KPNA1;MAP2K4;ACTR2;HSP90AA1;RIPK3;CHUK;DYNLT1;EXOC7;VPS33A;TRAF2;IRAK4;DYNLL2;TUBA4A;RHOB;DNM2;DYNC1LI2;TUBB2A;TRAF6;ELMO1;ELMO2;PIK3C3;RAF1;EXOC2;ARL8A;BIRC2;BIRC3;DCTN6;DYNC1I2;DCTN5;ROCK2;DCTN4;TCF7;KLC1;ACTR3B;DYNC2LI1;CYTH3;MAPK9;ACTR3C;PAK1;MAPK8;KLC2;CYTH4;IRAK1;MYO6;VPS11;FLNA;MAPK1;NCKAP1L;SNX9;RIPK1;MAP2K7;CYTH1;VPS16;MAP2K6;MAPK3;GSDMD;DYNC1H1;JUN;MLKL;TNFRSF10A;TUBB4B;MAPK14;NFKB1;MAPK13;NFKBIA;ABI1;VPS41;BCL2;PLEKHM1;CTNNB1;TAB2;PKN1;TAB1 Measles 58/139 0 0 0 0 2.3938 33.5229 GSK3B;CDKN1B;PIK3CD;TNFAIP3;ADAR;CASP9;IKBKB;TBK1;CASP8;AKT2;AKT1;MAP3K7;IKBKE;JAK1;IFNAR2;CSNK2A1;APAF1;CHUK;DDX58;CSNK2A2;IRAK4;CCNE2;IRF3;TRAF3;OAS3;TRAF6;IRF7;CD46;TP53;IRF9;PIK3R3;PIK3R1;RCHY1;MAPK9;MAPK8;IRAK1;SLAMF1;STAT5A;JUN;MX2;HSPA6;MX1;EIF2AK3;EIF2AK2;EIF2AK4;IL2;NFKB1;NFKBIA;MAVS;CDK6;IL2RA;BCL2;CD28;FAS;TAB2;HSPA1B;NFKBIB;HSPA1A RNA degradation 38/79 0 0 0 0 3.0931 42.638 DDX6;ZCCHC7;BTG2;DIS3L;PARN;ENO2;TOB2;TENT4B;TOB1;EDC3;EDC4;EXOSC6;EXOSC10;DHX36;EXOSC8;MTREX;EXOSC2;EXOSC1;HSPA9;TTC37;CNOT6L;PNPT1;DIS3;CNOT10;PATL1;CNOT4;LSM8;CNOT6;PFKL;XRN1;CNOT1;CNOT2;SKIV2L;DCP1A;CNOT9;DCP2;PFKP;DCP1B PD-L1 expression and PD-1 checkpoint pathway in cancer 41/89 0 0 0 0 2.8511 37.9934 PTEN;PIK3CD;PIK3R3;PIK3R1;HIF1A;RASGRP1;IKBKB;PPP3CA;PPP3CB;PPP3CC;AKT2;AKT1;MAPK1;PLCG1;JAK2;JAK1;MAP2K6;MAPK3;JUN;CHUK;CSNK2A1;IFNGR1;CSNK2A2;NFATC3;NFATC2;NFATC1;MAPK14;NFKB1;BATF;MAPK13;EML4;NFKBIA;ZAP70;CD4;RPS6KB1;TRAF6;RPS6KB2;CD28;PRKCQ;RAF1;NFKBIB Endocytosis 90/252 0 0.0001 0 0 1.8605 23.1367 WASHC4;WASHC5;TFRC;WIPF1;SH3KBP1;WIPF2;CLTC;WASHC2C;ARRB1;WASL;AP2A2;WASHC2A;EEA1;ZFYVE27;CHMP1B;PSD4;VPS36;SH3GL1;USP8;ACTR2;PDCD6IP;IST1;VPS37A;EPS15L1;ARAP1;VPS37B;RBSN;ARFGAP1;TGFBR1;RNF41;ARFGAP2;DNM2;EPN2;TGFBR2;RUFY1;ACAP2;ZFYVE16;ACAP1;RABEP1;HGS;TRAF6;RUFY2;STAM2;CHMP7;VPS28;AGAP2;CXCR4;ASAP1;VPS26B;CBL;ACTR3B;PRKCZ;CYTH3;ACTR3C;SNX1;RAB11FIP1;GRK2;CYTH4;GRK5;MVB12B;PIP5K1A;PIP5K1C;EPS15;LDLR;RAB11FIP4;CYTH1;SMAD2;ARFGEF1;GIT2;ARFGEF2;SMAD3;SMURF2;IQSEC1;GBF1;HSPA6;WWP1;STAM;AP2B1;IGF2R;PML;EHD1;ITCH;EHD4;NEDD4;IL2RA;MDM2;VPS45;SMAP1;HSPA1B;HSPA1A NOD-like receptor signaling pathway 69/181 0 0.0001 0 0 2.0604 25.5525 TNFAIP3;ANTXR2;IKBKB;PANX1;PSTPIP1;TBK1;CASP8;NAMPT;DNM1L;MAP3K7;IKBKE;JAK1;IFNAR2;GBP5;GABARAPL1;HSP90AA1;CHUK;RIPK3;TRAF2;IRAK4;ATG12;PLCB3;AIM2;IRF3;TRAF3;OAS3;TRAF6;TRAF5;IRF7;BIRC2;IRF9;BIRC3;RNASEL;NLRX1;ITPR2;XIAP;ITPR3;TANK;MAPK9;MAPK8;SHARPIN;NLRP6;IFI16;MFN1;MAPK1;MFN2;RIPK1;TP53BP1;GBP3;MAPK3;GSDMD;JUN;CARD8;NEK7;TRPV2;ERBIN;MAPK14;NFKB1;MAPK13;NFKBIA;P2RX7;MAVS;ATG16L1;BCL2;TAB2;TAB1;PKN1;MCU;NFKBIB Th17 cell differentiation 46/107 0 0.0001 0 0 2.5177 31.1846 RORC;AHR;HIF1A;IL27RA;IKBKB;RXRB;PPP3CA;MAPK9;PPP3CB;MAPK8;PPP3CC;IL21R;MAPK1;STAT6;PLCG1;JAK2;IL12RB1;IL6R;JAK1;MAPK3;SMAD2;STAT5A;JUN;SMAD4;HSP90AA1;IL4R;SMAD3;CHUK;IFNGR1;NFATC3;NFATC2;NFATC1;MAPK14;IL2;NFKB1;TGFBR1;RUNX1;TGFBR2;MAPK13;NFKBIA;ZAP70;CD4;IRF4;IL2RA;PRKCQ;NFKBIB Phosphatidylinositol signaling system 42/97 0 0.0001 0 0 2.5483 29.7045 IPPK;PI4K2B;DGKE;DGKD;MTMR3;INPP1;PTEN;ITPR2;PIK3R3;PIK3CD;ITPR3;PIK3R1;PIK3C2A;MTMR6;MTM1;INPP5B;PIP4P2;PIP4P1;INPP5F;PPIP5K2;INPP5D;PLCG2;PIP4K2A;PIP5K1A;PIP4K2B;PIP4K2C;PIP5K1C;PLCG1;IP6K2;PRKCB;SACM1L;IPMK;SYNJ2;DGKZ;ITPKB;PLCB3;SYNJ1;PIK3C3;PI4KB;PI4K2A;PLCD1;CDS2 Neurotrophin signaling pathway 49/119 0 0.0001 0 0 2.3373 27.1927 GSK3B;PRDM4;PIK3CD;IKBKB;RPS6KA3;AKT2;AKT1;MAP3K5;PDPK1;IRAK4;TRAF6;MAPKAPK2;RAF1;SOS1;TP53;CRK;SOS2;ATF4;ZNF274;CAMK2D;PSEN2;PIK3R3;PIK3R1;PSEN1;FOXO3;MAPK9;MAPK8;MAPK7;IRAK1;PLCG2;MAPK1;PLCG1;MAP2K7;CAMK2G;SH2B3;MAP2K5;MAPK3;SH2B1;JUN;MAP3K1;KIDINS220;BRAF;MAPK14;NFKB1;MAPK13;NFKBIA;CAMK4;BCL2;NFKBIB Chronic myeloid leukemia 35/76 0 0.0001 0 0 2.847 32.9846 RB1;CDKN1B;CTBP1;PIK3CD;PIK3R3;PIK3R1;CBL;IKBKB;AKT2;AKT1;MAPK1;E2F3;POLK;MAPK3;STAT5A;SMAD4;SMAD3;CHUK;GADD45B;GADD45A;BRAF;TGFBR1;NFKB1;DDB2;RUNX1;TGFBR2;GADD45G;NFKBIA;CDK6;MDM2;RAF1;SOS1;CRK;SOS2;TP53 Pancreatic cancer 35/76 0 0.0001 0 0 2.847 32.9846 RB1;PIK3CD;PIK3R3;PIK3R1;BRCA2;CASP9;IKBKB;MAPK9;MAPK8;AKT2;AKT1;MAPK1;E2F3;POLK;RALGDS;JAK1;MAPK3;SMAD2;SMAD4;SMAD3;CHUK;GADD45B;GADD45A;BRAF;TGFBR1;NFKB1;DDB2;TGFBR2;GADD45G;CDK6;RPS6KB1;RPS6KB2;RAF1;TP53;ARHGEF6 1–20 of 314 itemsof 16 pagesDownloading entire data
You must use "Save as" or "Save link as" from the context menu (by right-clicking the button) to download the entire data.
Cluster: c8
Markers
| 0 | 1.6109 | 0.935 | 0.351 | 0 | c8 | CD8A |
| 0 | 1.801 | 0.873 | 0.297 | 0 | c8 | CD8B |
| 0 | 2.3337 | 0.598 | 0.126 | 0 | c8 | XCL2 |
| 0 | 1.8784 | 0.808 | 0.345 | 0 | c8 | CCL4 |
| 0 | 1.3645 | 0.716 | 0.258 | 0 | c8 | KLRD1 |
| 0 | 1.4779 | 0.825 | 0.383 | 0 | c8 | CTSW |
| 0 | 2.3888 | 0.531 | 0.113 | 0 | c8 | XCL1 |
| 0 | 2.3438 | 0.551 | 0.16 | 0 | c8 | CCL4L2 |
| 0 | 1.7786 | 0.481 | 0.127 | 0 | c8 | CD160 |
| 1.423e-302 | 0.9453 | 0.995 | 0.634 | 4.772e-298 | c8 | CCL5 |
| 4.094e-299 | 1.2375 | 0.821 | 0.375 | 1.373e-294 | c8 | HOPX |
| 7.396e-250 | 0.558 | 0.952 | 0.453 | 2.48e-245 | c8 | NKG7 |
| 1.366e-232 | 1.3531 | 0.685 | 0.333 | 4.581e-228 | c8 | ITM2C |
| 6.86e-182 | 1.394 | 0.594 | 0.283 | 2.301e-177 | c8 | CAPG |
| 3.318e-180 | 3.2 | 0.121 | 0.014 | 1.113e-175 | c8 | CD8B2 |
| 6.772e-176 | 0.9965 | 0.5 | 0.192 | 2.271e-171 | c8 | LINC02446 |
| 1.047e-174 | 1.0086 | 0.628 | 0.297 | 3.512e-170 | c8 | AOAH |
| 4.582e-163 | 1.9829 | 0.262 | 0.072 | 1.537e-158 | c8 | CD248 |
| 1.276e-148 | 1.8138 | 0.282 | 0.086 | 4.279e-144 | c8 | SPINK2 |
| 1.127e-141 | 1.3834 | 0.467 | 0.208 | 3.779e-137 | c8 | SPRY1 |
Downloading entire data
You must use "Save as" or "Save link as" from the context menu (by right-clicking the button) to download the entire data.
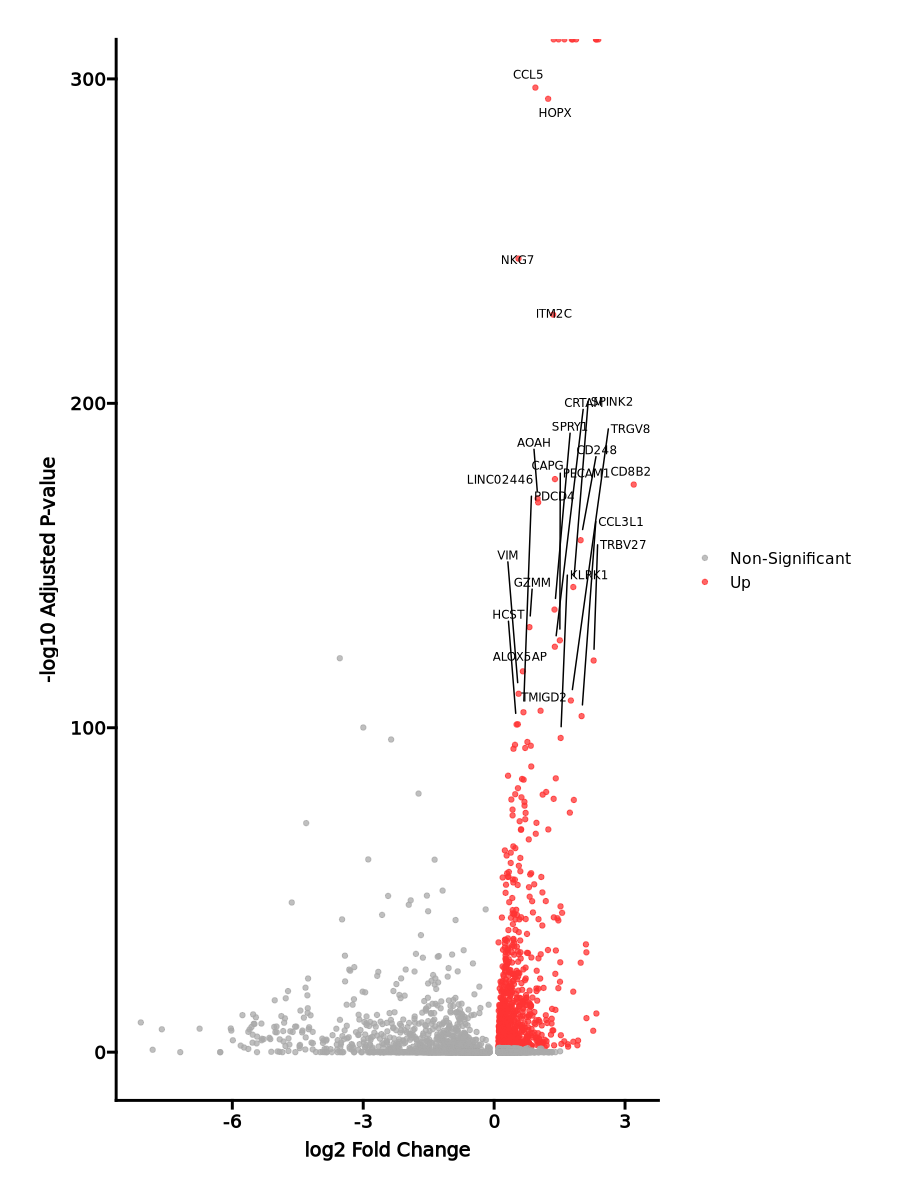
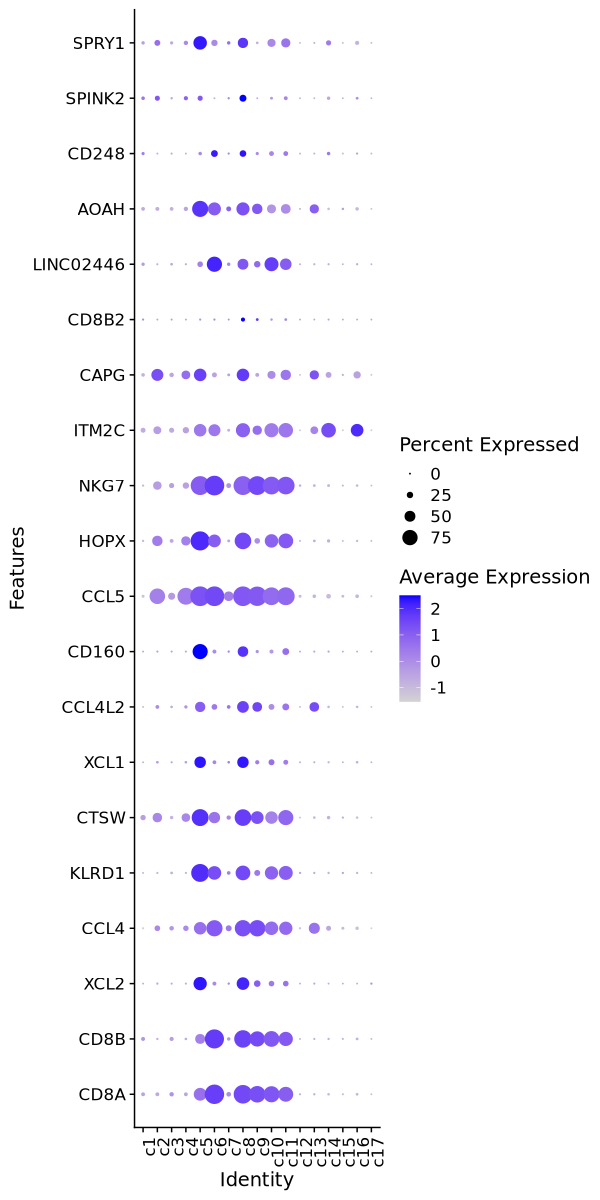
Enrichment Analysis
- The enrichment analysis results of the top biological pathways associated with the input gene set. Each bar represents a pathway, with the length of the bar indicating the number of input genes overlapping with genes in that pathway. The color intensity of the bars reflects the statistical significance of the enrichment (p-value).Image loading error!
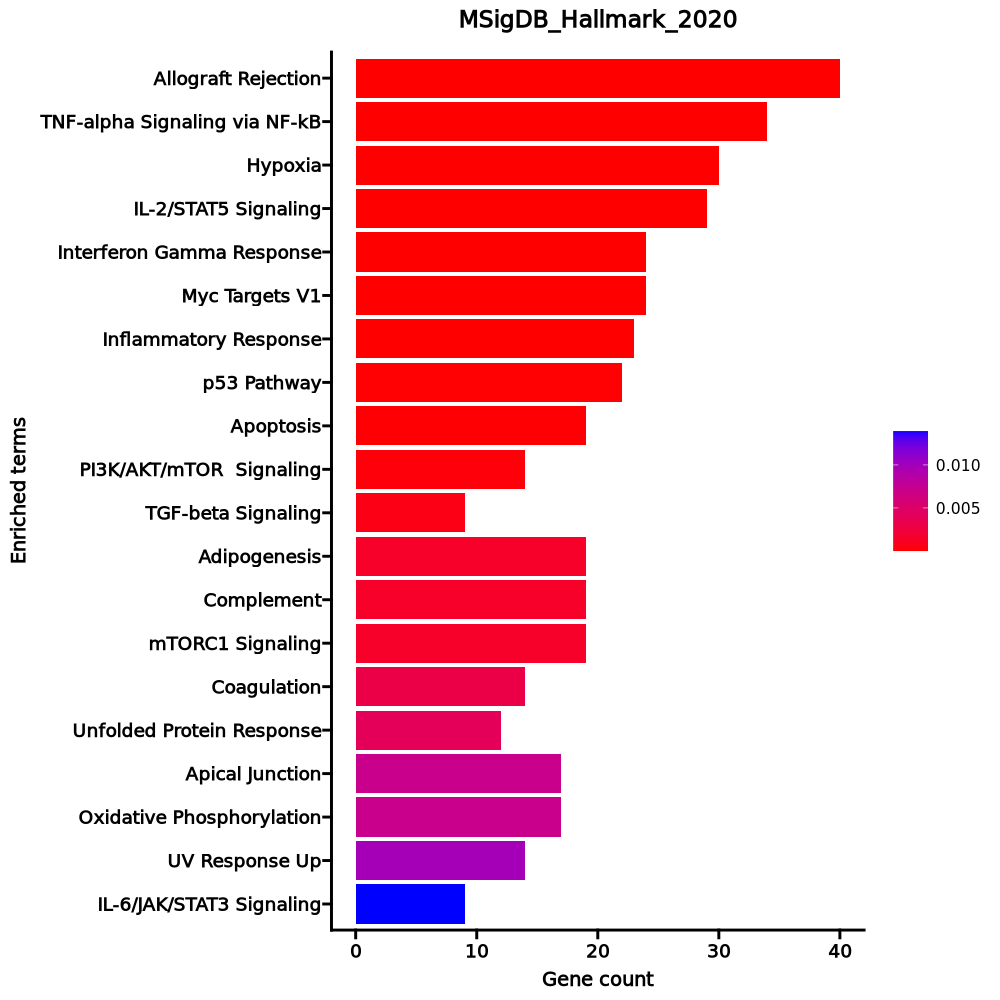
Allograft Rejection 40/200 5.101e-16 0 0 0 5.664 199.4392 GPR65;GCNT1;CD3G;CAPG;FASLG;CD3E;CD3D;TNF;HDAC9;ICAM1;IL18RAP;SOCS1;RPS19;SIT1;CXCR3;CCL5;CCL4;STAT4;NLRP3;B2M;RPL39;TPD52;EIF5A;CD96;TGFB1;IFNGR1;F2R;CRTAM;IL2;TAPBP;CD2;CD8B;IFNG;CD8A;LCK;CD7;KLRD1;DEGS1;LCP2;PTPN6 TNF-alpha Signaling via NF-kB 34/200 0 0 0 0 4.6059 116.5696 PTGER4;PPP1R15A;PFKFB3;BCL2A1;TNF;ICAM1;ZFP36;MYC;CCL5;CCL4;SLC16A6;MAP3K8;MCL1;EGR1;JUN;EGR2;GADD45B;DUSP1;GFPT2;FOS;PNRC1;FOSL2;EHD1;NR4A2;NR4A1;KLF6;TUBB2A;NR4A3;ID2;REL;TNFSF9;FOSB;CD69;ATF3 Hypoxia 30/200 0 0 0 0 3.9488 76.6515 PPP1R15A;GPI;PFKFB3;CITED2;CXCR4;ENO2;PRDX5;ZFP36;FAM162A;PGK1;IDS;TPD52;JUN;TPI1;ANXA2;HSPA5;DUSP1;IGFBP3;MIF;FOS;PNRC1;JMJD6;FOSL2;TPST2;KLF6;BCL2;MYH9;S100A4;ALDOA;ATF3 IL-2/STAT5 Signaling 29/199 0 0 0 0 3.8127 69.1886 RNH1;ABCB1;PTGER2;GPR65;ODC1;CAPG;ITGAE;CST7;NT5E;PNP;SOCS1;GLIPR2;MYC;MAP3K8;EOMES;GABARAPL1;PRKCH;GADD45B;CISH;IFNGR1;DHRS3;HOPX;SERPINB6;TWSG1;ARL4A;KLF6;BCL2;CD48;CDC42SE2 Interferon Gamma Response 24/200 0 0.0001 0 0 3.0289 35.6108 IFITM2;AUTS2;HLA-B;LYSMD2;SRI;ICAM1;TAPBP;VAMP8;ARL4A;PNP;KLRK1;SOCS1;CCL5;PSME1;STAT4;TXNIP;SLAMF7;XCL1;ITGB7;LCP2;PTPN6;CD69;B2M;GPR18 Myc Targets V1 24/200 0 0.0001 0 0 3.0289 35.6108 CCT2;XRCC6;SET;HSP90AB1;SSB;EIF1AX;PTGES3;RPS5;GLO1;CNBP;ODC1;PA2G4;HSPE1;MYC;PCBP1;CANX;RPS3;PGK1;AP3S1;PABPC1;RPS2;BUB3;EIF4G2;CCT4 Inflammatory Response 23/200 0 0.0002 0 0 2.8828 30.656 PTGER4;IFITM1;PTGER2;ICAM4;EMP3;SRI;SLC4A4;ICAM1;TAPBP;GPR132;KLF6;IL18RAP;SELENOS;LCK;MYC;CCL5;TNFSF9;NLRP3;CD48;NMUR1;LCP2;CD69;CD55 p53 Pathway 22/200 0.0001 0.0004 0 0 2.7386 26.1773 CYFIP2;PPP1R15A;JUN;TGFB1;F2R;SLC3A2;FOS;BAIAP2;PITPNC1;ZFP36L1;VAMP8;SOCS1;MAPKAPK3;FAM162A;PERP;TXNIP;TNFSF9;STOM;S100A4;ATF3;RPS12;S100A10 Apoptosis 19/161 0.0001 0.0005 0 0 2.96 27.7594 BCAP31;JUN;ANXA1;GADD45B;ROCK1;IFNGR1;F2R;FASLG;ENO2;TNF;CLU;CD2;DNAJA1;FEZ1;PDCD4;TXNIP;CD69;ATF3;MCL1 PI3K/AKT/mTOR Signaling 14/105 0.0002 0.001 0 0 3.3928 28.9529 ARF1;CXCR4;FASLG;HSP90B1;TNFRSF1A;PPP1CA;LCK;ARHGDIA;CAMK4;CFL1;MAPK1;CALR;RAC1;MAP2K6 TGF-beta Signaling 9/54 0.0005 0.0024 0 0 4.3959 33.2562 PPP1R15A;WWTR1;TGFB1;SMURF2;ID2;THBS1;TGFBR1;RHOA;PPP1CA Adipogenesis 19/200 0.0013 0.0047 0 0 2.3175 15.3661 COX7B;PHYH;RNF11;PFKFB3;IFNGR1;MGST3;CHCHD10;UQCR11;GHITM;DHRS7;ARL4A;SCP2;REEP5;CMPK1;G3BP2;PDCD4;STOM;ALDOA;MGLL Complement 19/200 0.0013 0.0047 0 0 2.3175 15.3661 USP14;HSPA5;LIPA;CLU;DUSP6;EHD1;DOCK10;CTSO;F8;GNG2;LCK;CCL5;FDX1;STX4;LCP2;FYN;CALM1;CD55;HSPA1A mTORC1 Signaling 19/200 0.0013 0.0047 0 0 2.3175 15.3661 HSPA9;PPP1R15A;GPI;FKBP2;TPI1;SDF2L1;HSPA5;CXCR4;HSPE1;SYTL2;HSP90B1;SLC9A3R1;PNP;CANX;PGK1;CD9;CALR;ALDOA;SKAP2 Coagulation 14/138 0.003 0.01 0 0 2.4856 14.443 ANXA1;USP11;HTRA1;CLU;THBS1;DUSP6;CTSO;F8;BMP1;CAPN2;PECAM1;CD9;FYN;RAC1 Unfolded Protein Response 12/113 0.004 0.0125 0 0 2.6128 14.4328 EIF4A2;HSPA9;SPCS3;TUBB2A;HSPA5;IMP3;SRPRA;CALR;YWHAZ;ATF3;HSP90B1;HERPUD1 Apical Junction 17/200 0.0071 0.0198 0 0 2.0459 10.116 VASP;CAP1;MSN;ICAM4;BAIAP2;SORBS3;ICAM1;MYL12B;BMP1;AKT3;ZYX;PECAM1;MYH9;STX4;EVL;CD99;SKAP2 Oxidative Phosphorylation 17/200 0.0071 0.0198 0 0 2.0459 10.116 HSPA9;GPI;COX7B;PHYH;ATP6V0E1;MGST3;COX17;NDUFB2;DLST;UQCR11;ATP1B1;ATP5F1E;COX7A2L;CYB5R3;MPC1;FDX1;SLC25A4 UV Response Up 14/158 0.0098 0.0258 0 0 2.1381 9.8887 ABCB1;RAB27A;ARRB2;FOS;ENO2;ICAM1;DNAJA1;NR4A1;BSG;FOSB;MGAT1;ALDOA;SLC25A4;ATF3 IL-6/JAK/STAT3 Signaling 9/87 0.0139 0.0345 0 0 2.5317 10.8213 JUN;SOCS1;TGFB1;IFNGR1;CD9;MAP3K8;TNF;IL9R;TNFRSF1A 1–20 of 50 itemsof 3 pagesDownloading entire data
You must use "Save as" or "Save link as" from the context menu (by right-clicking the button) to download the entire data.
- The enrichment analysis results of the top biological pathways associated with the input gene set. Each bar represents a pathway, with the length of the bar indicating the number of input genes overlapping with genes in that pathway. The color intensity of the bars reflects the statistical significance of the enrichment (p-value).Image loading error!
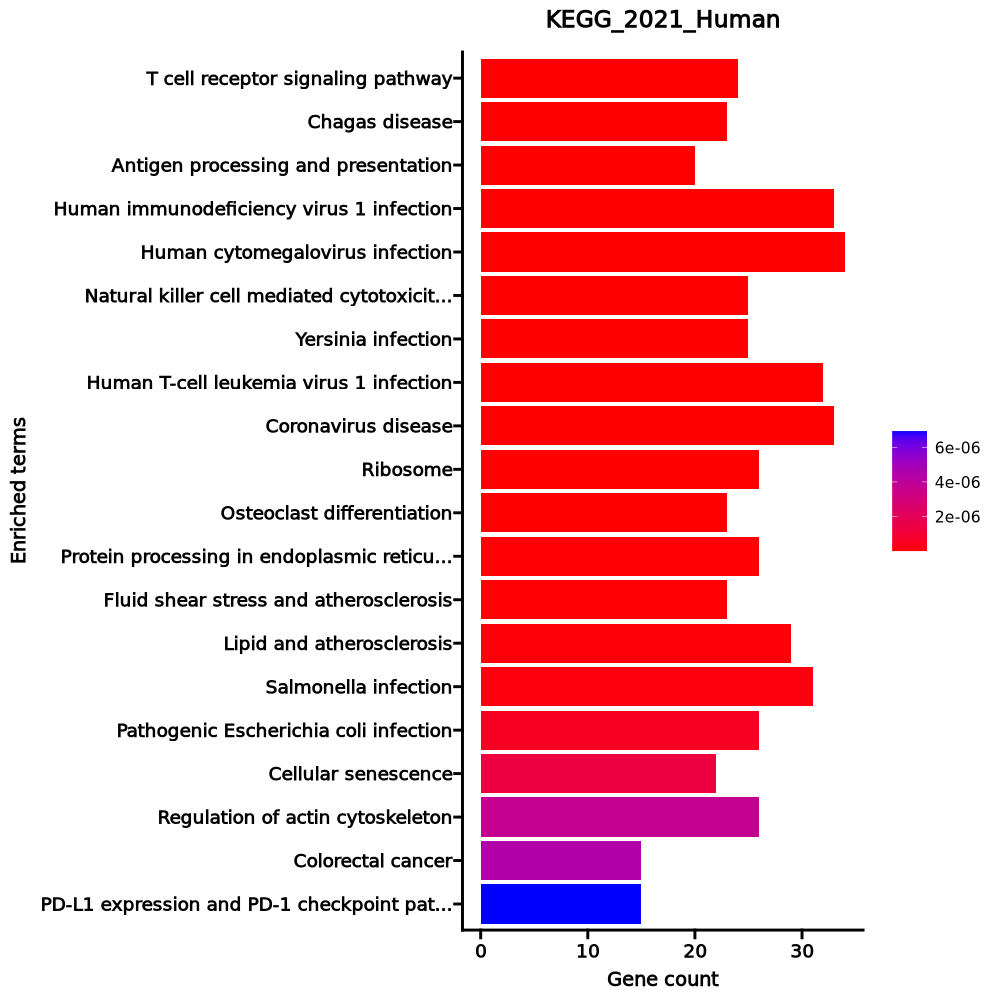
T cell receptor signaling pathway 24/104 0 0 0 0 6.6974 166.7377 JUN;MAP2K2;CD8B2;CD3G;PIK3R1;FOS;CD3E;TNF;CD3D;IL2;RHOA;CDC42;PPP3CA;CD8B;IFNG;CD8A;LCK;GRAP2;AKT3;MAPK1;MAP3K8;LCP2;FYN;PTPN6 Chagas disease 23/102 0 0 0 0 6.4923 152.0356 JUN;TGFB1;CCL3L1;IFNGR1;CD3G;FASLG;PIK3R1;FOS;CD3E;TNF;CD3D;IL2;TGFBR1;TNFRSF1A;GNAO1;IFNG;PPP2R2B;CCL5;AKT3;GNAS;CCL3;MAPK1;CALR Antigen processing and presentation 20/78 0 0 0 0 7.6711 176.6963 PDIA3;HSP90AB1;HSPA5;KLRC4;CD8B2;HLA-B;HLA-C;TNF;TAPBP;CD8B;IFNG;CD8A;CANX;PSME1;KLRD1;KLRC1;CALR;B2M;HSPA1B;HSPA1A Human immunodeficiency virus 1 infection 33/212 0 0 0 0 4.138 91.8292 CXCR4;CD3G;FASLG;PIK3R1;CD3E;CD3D;TNF;PPP3CA;GNG2;AP1G2;AKT3;CFL1;MAPK1;PTK2B;RAC1;B2M;SKP1;MAP2K6;PDIA3;JUN;MAP2K2;LIMK1;HLA-B;HLA-C;FOS;RBX1;TAPBP;TNFRSF1A;GNAO1;BCL2;CALR;CALM1;CALM2 Human cytomegalovirus infection 34/225 0 0 0 0 3.9977 87.9622 PTGER4;CCL3L1;ROCK1;PTGER2;CCL4L2;CXCR4;FASLG;PIK3R1;TNF;PPP3CA;GNG2;MYC;CCL5;AKT3;CCL4;CCL3;MAPK1;PTK2B;RAC1;B2M;PRKACB;MAP2K6;PDIA3;MAP2K2;HLA-B;HLA-C;RHOA;TAPBP;TNFRSF1A;GNAO1;GNAS;CALR;CALM1;CALM2 Natural killer cell mediated cytotoxicity 25/131 0 0 0 0 5.2643 113.2349 FASLG;PIK3R1;TNF;ICAM1;PPP3CA;KLRK1;KLRC4-KLRK1;MAPK1;PTK2B;FYN;KLRC1;RAC1;MAP2K2;IFNGR1;HLA-B;HLA-C;NCR3;IFNG;LCK;KLRD1;CD48;LCP2;PTPN6;HCST;CD244 Yersinia infection 25/137 0 0 0 0 4.9807 102.2359 ROCK1;PIK3R1;TNF;CDC42;AKT3;NLRP3;MAPK1;PTK2B;RAC1;MAP2K6;JUN;MAP2K2;LIMK1;CD8B2;FOS;BAIAP2;IL2;RHOA;CD8B;CD8A;LCK;LCP2;ARHGEF7;SKAP2;ARF6 Human T-cell leukemia virus 1 infection 32/219 0 0 0 0 3.8348 76.4567 CD3G;PIK3R1;CD3E;CD3D;TNF;ICAM1;ANAPC11;PPP3CA;ZFP36;CDC26;MYC;AKT3;MAPK1;BUB3;B2M;PRKACB;EGR1;EGR2;JUN;MAP2K2;TGFB1;HLA-B;HLA-C;FOS;IL2;TGFBR1;TNFRSF1A;LCK;CANX;CALR;TLN1;SLC25A4 Coronavirus disease 33/232 0 0 0 0 3.7182 73.6806 RPL10;RPLP1;RPL36A;PIK3R1;RPL8;TNF;RPS4X;RPS19;RPS18;RPS3;RPL35;RPLP2;RPL13;NLRP3;MAPK1;RPL38;RPS2;RPL39;RPL17;RPS12;JUN;RPL21;RPS7;RPS5;RPL23A;FOS;IL2;TNFRSF1A;RPS29;RPL27A;RPL27;RPS20;RPL22L1 Ribosome 26/158 0 0 0 0 4.3956 83.4901 RPL10;RPLP1;RPL36A;RPL8;RPS4X;RPS19;RPS18;RPS3;RPL35;RPLP2;RPL13;RPL38;RPS2;RPL39;RPL17;RPS12;RPL21;RPS7;RPS5;RPL23A;MRPS6;RPS29;RPL27A;RPL27;RPS20;RPL22L1 Osteoclast differentiation 23/127 0 0 0 0 4.9252 92.8552 JUN;TGFB1;NCF1;IFNGR1;CYBA;PIK3R1;FOS;TNF;TGFBR1;FOSL2;TNFRSF1A;PPP3CA;SOCS1;IFNG;LCK;CAMK4;AKT3;MAPK1;FOSB;LCP2;FYN;RAC1;MAP2K6 Protein processing in endoplasmic reticulum 26/171 0 0 0 0 3.9988 69.2032 PPP1R15A;TRAM1;HSP90AB1;DERL1;HSP90B1;HERPUD1;SEC61G;CAPN2;SEC62;SKP1;PDIA3;BCAP31;HSPA5;SSR4;RAD23A;SVIP;RBX1;DNAJA1;SELENOS;DAD1;CANX;BCL2;STUB1;CALR;HSPA1B;HSPA1A Fluid shear stress and atherosclerosis 23/139 0 0 0 0 4.4129 75.3803 JUN;HSP90AB1;NCF1;DUSP1;MGST3;GSTP1;CYBA;PIK3R1;FOS;TNF;RHOA;ICAM1;HSP90B1;TNFRSF1A;IFNG;GSTA4;AKT3;BCL2;PECAM1;RAC1;CALM1;CALM2;MAP2K6 Lipid and atherosclerosis 29/215 0 0 0 0 3.4818 57.1209 HSP90AB1;NCF1;CCL3L1;FASLG;PIK3R1;TNF;ICAM1;HSP90B1;RAP1B;CDC42;PPP3CA;CCL5;AKT3;CCL3;NLRP3;MAPK1;RAC1;MAP2K6;JUN;HSPA5;CYBA;FOS;RHOA;TNFRSF1A;BCL2;CALM1;CALM2;HSPA1B;HSPA1A Salmonella infection 31/249 0 0 0 0 3.1777 49.516 CYFIP2;ARF1;RAB5C;HSP90AB1;TNF;MYL12A;MYL12B;HSP90B1;CDC42;TUBA1A;MYC;AKT3;RPS3;NLRP3;MAPK1;RAC1;SKP1;S100A10;MAP2K6;JUN;MAP2K2;ANXA2;VPS33A;DYNLT3;FOS;RHOA;TNFRSF1A;TUBB2A;BCL2;ARF6;RAB7A Pathogenic Escherichia coli infection 26/197 0 0 0 0 3.3861 48.8733 CYFIP2;ARF1;ROCK1;FASLG;TNF;CDC42;SLC9A3R1;TUBA1A;RPS3;NLRP3;MAPK1;FYN;RAC1;JUN;F2R;FOS;BAIAP2;RHOA;TNFRSF1A;TUBB2A;LPAR5;NCL;MYH9;PTPN6;ARF6;MYO1G Cellular senescence 22/156 0 0 0 0 3.6463 49.4395 MAP2K2;TGFB1;GADD45B;IGFBP3;HLA-B;HLA-C;RRAS2;PIK3R1;ZFP36L2;TGFBR1;ZFP36L1;PPP1CA;RBL2;PPP3CA;MYC;AKT3;CAPN2;MAPK1;CALM1;CALM2;SLC25A4;MAP2K6 Regulation of actin cytoskeleton 26/218 0 0.0001 0 0 3.0124 37.6586 CYFIP2;ROCK1;CXCR4;IQGAP1;PIK3R1;ITGAE;MYL12A;MYL12B;CDC42;TMSB4X;CFL1;MAPK1;ITGB7;RAC1;MAP2K2;F2R;ITGA1;LIMK1;RRAS2;MSN;BAIAP2;RHOA;PPP1CA;LPAR5;MYH9;ARHGEF7 Colorectal cancer 15/86 0 0.0001 0 0 4.6695 57.51 JUN;MAP2K2;TGFB1;GADD45B;FOS;PIK3R1;RHOA;TGFBR1;MSH3;MYC;AKT3;BCL2;MAPK1;RAC1;APPL1 PD-L1 expression and PD-1 checkpoint pathway in cancer 15/89 0 0.0001 0 0 4.4794 53.2068 JUN;MAP2K2;IFNGR1;CD3G;FOS;PIK3R1;CD3E;CD3D;PPP3CA;IFNG;LCK;AKT3;MAPK1;PTPN6;MAP2K6 1–20 of 278 itemsof 14 pagesDownloading entire data
You must use "Save as" or "Save link as" from the context menu (by right-clicking the button) to download the entire data.
Running Information
Showing the first job only. Check the workdir for information of other jobs if any.
# Generated by pipen_runinfo v0.8.2
# Lang: R
R version 4.3.3 (2024-02-29)
Platform: x86_64-conda-linux-gnu (64-bit)
Running under: Debian GNU/Linux 11 (bullseye)

Matrix products: default
BLAS/LAPACK: /opt/conda/lib/libopenblasp-r0.3.28.so;  LAPACK version 3.12.0

locale:
 [1] LC_CTYPE=C.UTF-8       LC_NUMERIC=C           LC_TIME=C.UTF-8
 [4] LC_COLLATE=C.UTF-8     LC_MONETARY=C.UTF-8    LC_MESSAGES=C.UTF-8
 [7] LC_PAPER=C.UTF-8       LC_NAME=C              LC_ADDRESS=C
[10] LC_TELEPHONE=C         LC_MEASUREMENT=C.UTF-8 LC_IDENTIFICATION=C

time zone: Etc/UTC
tzcode source: system (glibc)

attached base packages:
[1] stats     graphics  grDevices utils     datasets  methods   base

other attached packages:
 [1] UpSetR_1.4.0        ggVennDiagram_1.2.3 tidyseurat_0.8.0
 [4] ttservice_0.4.1     future_1.34.0       ggrepel_0.9.6
 [7] ggprism_1.0.5       ggplot2_3.5.1       enrichR_3.4
[10] Seurat_5.1.0        SeuratObject_5.0.2  sp_2.2-0
[13] tibble_3.2.1        tidyr_1.3.1         dplyr_1.1.4
[16] tidyselect_1.2.1    digest_0.6.37       jsonlite_1.8.9
[19] rlang_1.1.5         logger_0.4.0

loaded via a namespace (and not attached):
  [1] deldir_2.0-4           pbapply_1.7-2          gridExtra_2.3
  [4] magrittr_2.0.3         RcppAnnoy_0.0.22       matrixStats_1.1.0
  [7] ggridges_0.5.6         compiler_4.3.3         spatstat.geom_3.3-5
 [10] png_0.1-8              vctrs_0.6.5            reshape2_1.4.4
 [13] stringr_1.5.1          pkgconfig_2.0.3        fastmap_1.2.0
 [16] ellipsis_0.3.2         labeling_0.4.3         promises_1.3.2
 [19] purrr_1.0.2            WriteXLS_6.7.0         RVenn_1.1.0
 [22] goftest_1.2-3          later_1.4.1            spatstat.utils_3.1-2
 [25] irlba_2.3.5.1          parallel_4.3.3         cluster_2.1.8
 [28] R6_2.6.0               ica_1.0-3              stringi_1.8.4
 [31] RColorBrewer_1.1-3     spatstat.data_3.1-4    limma_3.58.1
 [34] reticulate_1.40.0      parallelly_1.42.0      spatstat.univar_3.1-1
 [37] lmtest_0.9-40          scattermore_1.2        Rcpp_1.0.14
 [40] tensor_1.5             future.apply_1.11.3    zoo_1.8-12
 [43] sctransform_0.4.1      httpuv_1.6.15          Matrix_1.6-5
 [46] splines_4.3.3          igraph_2.0.3           abind_1.4-5
 [49] spatstat.random_3.3-2  codetools_0.2-20       miniUI_0.1.1.1
 [52] spatstat.explore_3.3-4 curl_6.0.1             listenv_0.9.1
 [55] lattice_0.22-6         plyr_1.8.9             withr_3.0.2
 [58] shiny_1.10.0           ROCR_1.0-11            Rtsne_0.17
 [61] fastDummies_1.7.5      survival_3.8-3         polyclip_1.10-7
 [64] fitdistrplus_1.2-2     pillar_1.10.1          KernSmooth_2.23-26
 [67] plotly_4.10.4          generics_0.1.3         RcppHNSW_0.6.0
 [70] munsell_0.5.1          scales_1.3.0           globals_0.16.3
 [73] xtable_1.8-4           glue_1.8.0             lazyeval_0.2.2
 [76] tools_4.3.3            data.table_1.16.4      RSpectra_0.16-2
 [79] RANN_2.6.2             leiden_0.4.3.1         dotCall64_1.2
 [82] cowplot_1.1.3          grid_4.3.3             colorspace_2.1-1
 [85] nlme_3.1-167           patchwork_1.3.0        presto_1.0.0
 [88] cli_3.6.4              spatstat.sparse_3.1-0  fansi_1.0.6
 [91] spam_2.11-1            viridisLite_0.4.2      uwot_0.2.2
 [94] gtable_0.3.6           progressr_0.15.1       rjson_0.2.23
 [97] htmlwidgets_1.6.4      farver_2.1.2           htmltools_0.5.8.1
[100] lifecycle_1.0.4        httr_1.4.7             statmod_1.5.0
[103] mime_0.12              MASS_7.3-60.0.1
# Generated by pipen-runinfo v0.8.2

real 331.52
user 244.67
sys 12.58
percent 77%
# Generated by pipen-runinfo v0.8.2

Scheduler
---------
local

Hostname
--------
mforgehn4.mayo.edu

CPU
----
Architecture:                         x86_64
CPU op-mode(s):                       32-bit, 64-bit
Byte Order:                           Little Endian
Address sizes:                        46 bits physical, 57 bits virtual
CPU(s):                               96
On-line CPU(s) list:                  0-95
Thread(s) per core:                   2
Core(s) per socket:                   24
Socket(s):                            2
NUMA node(s):                         2
Vendor ID:                            GenuineIntel
CPU family:                           6
Model:                                106
Model name:                           Intel(R) Xeon(R) Gold 6342 CPU @ 2.80GHz
Stepping:                             6
CPU MHz:                              3500.000
CPU max MHz:                          3500.0000
CPU min MHz:                          800.0000
BogoMIPS:                             5600.00
Virtualization:                       VT-x
L1d cache:                            2.3 MiB
L1i cache:                            1.5 MiB
L2 cache:                             60 MiB
L3 cache:                             72 MiB
NUMA node0 CPU(s):                    0,2,4,6,8,10,12,14,16,18,20,22,24,26,28,30,32,34,36,38,40,42,44,46,48,50,52,54,56,58,60,62,64,66,68,70,72,74,76,78,80,82,84,86,88,90,92,94
NUMA node1 CPU(s):                    1,3,5,7,9,11,13,15,17,19,21,23,25,27,29,31,33,35,37,39,41,43,45,47,49,51,53,55,57,59,61,63,65,67,69,71,73,75,77,79,81,83,85,87,89,91,93,95
Vulnerability Gather data sampling:   Mitigation; Microcode
Vulnerability Itlb multihit:          Not affected
Vulnerability L1tf:                   Not affected
Vulnerability Mds:                    Not affected
Vulnerability Meltdown:               Not affected
Vulnerability Mmio stale data:        Mitigation; Clear CPU buffers; SMT vulnerable
Vulnerability Reg file data sampling: Not affected
Vulnerability Retbleed:               Not affected
Vulnerability Spec rstack overflow:   Not affected
Vulnerability Spec store bypass:      Mitigation; Speculative Store Bypass disabled via prctl
Vulnerability Spectre v1:             Mitigation; usercopy/swapgs barriers and __user pointer sanitization
Vulnerability Spectre v2:             Mitigation; Enhanced / Automatic IBRS; IBPB conditional; RSB filling; PBRSB-eIBRS SW sequence; BHI SW loop, KVM SW loop
Vulnerability Srbds:                  Not affected
Vulnerability Tsx async abort:        Not affected
Flags:                                fpu vme de pse tsc msr pae mce cx8 apic sep mtrr pge mca cmov pat pse36 clflush dts acpi mmx fxsr sse sse2 ss ht tm pbe syscall nx pdpe1gb rdtscp lm constant_tsc art arch_perfmon pebs bts rep_good nopl xtopology nonstop_tsc cpuid aperfmperf pni pclmulqdq dtes64 monitor ds_cpl vmx smx est tm2 ssse3 sdbg fma cx16 xtpr pdcm pcid dca sse4_1 sse4_2 x2apic movbe popcnt tsc_deadline_timer aes xsave avx f16c rdrand lahf_lm abm 3dnowprefetch cpuid_fault epb cat_l3 invpcid_single intel_ppin ssbd mba ibrs ibpb stibp ibrs_enhanced tpr_shadow vnmi flexpriority ept vpid ept_ad fsgsbase tsc_adjust bmi1 avx2 smep bmi2 erms invpcid cqm rdt_a avx512f avx512dq rdseed adx smap avx512ifma clflushopt clwb intel_pt avx512cd sha_ni avx512bw avx512vl xsaveopt xsavec xgetbv1 xsaves cqm_llc cqm_occup_llc cqm_mbm_total cqm_mbm_local split_lock_detect wbnoinvd dtherm ida arat pln pts avx512vbmi umip pku ospke avx512_vbmi2 gfni vaes vpclmulqdq avx512_vnni avx512_bitalg tme avx512_vpopcntdq la57 rdpid fsrm md_clear pconfig flush_l1d arch_capabilities

Memory
------